Is Brown & Brown Inc’s (BRO) ROE Of 11.27% Sustainable?

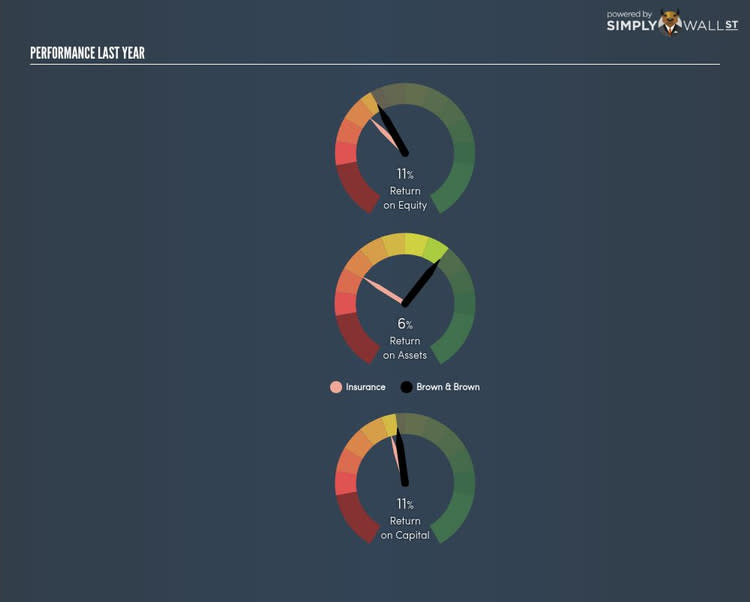
Brown & Brown Inc (NYSE:BRO) delivered an ROE of 11.27% over the past 12 months, which is an impressive feat relative to its industry average of 8.79% during the same period. Superficially, this looks great since we know that BRO has generated big profits with little equity capital; however, ROE doesn’t tell us how much BRO has borrowed in debt. We’ll take a closer look today at factors like financial leverage to determine whether BRO’s ROE is actually sustainable. View our latest analysis for Brown & Brown
Peeling the layers of ROE – trisecting a company’s profitability
Return on Equity (ROE) weighs BRO’s profit against the level of its shareholders’ equity. It essentially shows how much BRO can generate in earnings given the amount of equity it has raised. While a higher ROE is preferred in most cases, there are several other factors we should consider before drawing any conclusions.
Return on Equity = Net Profit ÷ Shareholders Equity
Returns are usually compared to costs to measure the efficiency of capital. BRO’s cost of equity is 9.83%. Given a positive discrepancy of 1.44% between return and cost, this indicates that BRO pays less for its capital than what it generates in return, which is a sign of capital efficiency. ROE can be dissected into three distinct ratios: net profit margin, asset turnover, and financial leverage. This is called the Dupont Formula:
Dupont Formula
ROE = profit margin × asset turnover × financial leverage
ROE = (annual net profit ÷ sales) × (sales ÷ assets) × (assets ÷ shareholders’ equity)
ROE = annual net profit ÷ shareholders’ equity
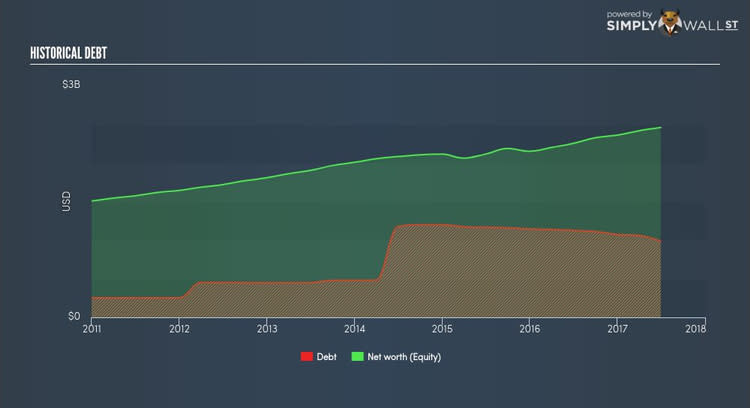
Essentially, profit margin shows how much money the company makes after paying for all its expenses. Asset turnover reveals how much revenue can be generated from BRO’s asset base. The most interesting ratio, and reflective of sustainability of its ROE, is financial leverage. Since ROE can be artificially increased through excessive borrowing, we should check BRO’s historic debt-to-equity ratio. At 40.09%, BRO’s debt-to-equity ratio appears low and indicates the above-average ROE is generated from its capacity to increase profit without a large debt burden.
What this means for you:
Are you a shareholder? BRO’s ROE is impressive relative to the industry average and also covers its cost of equity. Since its high ROE is not likely driven by high debt, it might be a good time to top up on your current holdings if your fundamental research reaffirms this analysis. If you're looking for new ideas for high-returning stocks, you should take a look at our free platform to see the list of stocks with Return on Equity over 20%.
Are you a potential investor? If you are considering investing in BRO, looking at ROE on its own is not enough to make a well-informed decision. I recommend you do additional fundamental analysis by looking through our most recent infographic report on Brown & Brown to help you make a more informed investment decision.
To help readers see pass the short term volatility of the financial market, we aim to bring you a long-term focused research analysis purely driven by fundamental data. Note that our analysis does not factor in the latest price sensitive company announcements.
The author is an independent contributor and at the time of publication had no position in the stocks mentioned.
