Should You Buy The E.W. Scripps Company (NASDAQ:SSP) For Its 1.3% Dividend?

Today we'll take a closer look at The E.W. Scripps Company (NASDAQ:SSP) from a dividend investor's perspective. Owning a strong business and reinvesting the dividends is widely seen as an attractive way of growing your wealth. Yet sometimes, investors buy a stock for its dividend and lose money because the share price falls by more than they earned in dividend payments.
With only a two-year payment history, and a 1.3% yield, investors probably think E.W. Scripps is not much of a dividend stock. Many of the best dividend stocks typically start out paying a low yield, so we wouldn't automatically cut it from our list of prospects. The company also bought back stock during the year, equivalent to approximately 0.6% of the company's market capitalisation at the time. Some simple research can reduce the risk of buying E.W. Scripps for its dividend - read on to learn more.
Explore this interactive chart for our latest analysis on E.W. Scripps!
Payout ratios
Dividends are typically paid from company earnings. If a company pays more in dividends than it earned, then the dividend might become unsustainable - hardly an ideal situation. So we need to form a view on if a company's dividend is sustainable, relative to its net profit after tax. E.W. Scripps paid out 257% of its profit as dividends, over the trailing twelve month period. A payout ratio above 100% is definitely an item of concern, unless there are some other circumstances that would justify it.
In addition to comparing dividends against profits, we should inspect whether the company generated enough cash to pay its dividend. Last year, E.W. Scripps paid a dividend while reporting negative free cash flow. While there may be an explanation, we think this behaviour is generally not sustainable.
Is E.W. Scripps's Balance Sheet Risky?
As E.W. Scripps's dividend was not well covered by earnings, we need to check its balance sheet for signs of financial distress. A rough way to check this is with these two simple ratios: a) net debt divided by EBITDA (earnings before interest, tax, depreciation and amortisation), and b) net interest cover. Net debt to EBITDA is a measure of a company's total debt. Net interest cover measures the ability to meet interest payments. Essentially we check that a) the company does not have too much debt, and b) that it can afford to pay the interest. With net debt of 9.14 times its EBITDA, E.W. Scripps could be described as a highly leveraged company. While some companies can handle this level of leverage, we'd be concerned about the dividend sustainability if there was any risk of an earnings downturn.
Net interest cover can be calculated by dividing earnings before interest and tax (EBIT) by the company's net interest expense. Interest cover of 1.99 times its interest expense is starting to become a concern for E.W. Scripps, and be aware that lenders may place additional restrictions on the company as well. Low interest cover and high debt can create problems right when the investor least needs them, and we're reluctant to rely on the dividend of companies with these traits.
We update our data on E.W. Scripps every 24 hours, so you can always get our latest analysis of its financial health, here.
Dividend Volatility
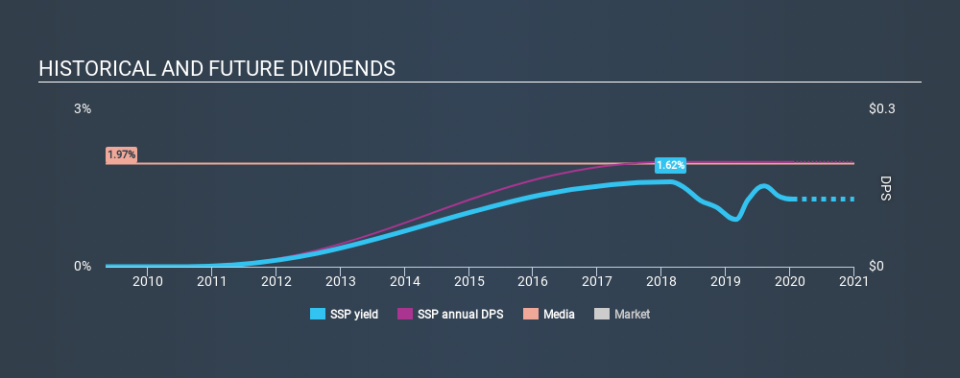
From the perspective of an income investor who wants to earn dividends for many years, there is not much point buying a stock if its dividend is regularly cut or is not reliable. The company has been paying a stable dividend for a few years now, but we'd like to see more evidence of consistency over a longer period. Its most recent annual dividend was US$0.20 per share, effectively flat on its first payment two years ago.
We like that the dividend hasn't been shrinking. However we're conscious that the company hasn't got an overly long track record of dividend payments yet, which makes us wary of relying on its dividend income.
Dividend Growth Potential
Dividend payments have been consistent over the past few years, but we should always check if earnings per share (EPS) are growing, as this will help maintain the purchasing power of the dividend. Strong earnings per share (EPS) growth might encourage our interest in the company despite fluctuating dividends, which is why it's great to see E.W. Scripps has grown its earnings per share at 36% per annum over the past five years. Earnings per share have been growing very rapidly, although the company is also paying out virtually all of its profit in dividends. Generally, a company that is growing rapidly while paying out a majority of its earnings, is seeing its debt burden increase. We'd be conscious of any extra risk added by this practice.
Conclusion
Dividend investors should always want to know if a) a company's dividends are affordable, b) if there is a track record of consistent payments, and c) if the dividend is capable of growing. We're a bit uncomfortable with E.W. Scripps paying out a high percentage of both its cashflow and earnings. We were also glad to see it growing earnings, although its dividend history is not as long as we'd like. With this information in mind, we think E.W. Scripps may not be an ideal dividend stock.
Earnings growth generally bodes well for the future value of company dividend payments. See if the 6 E.W. Scripps analysts we track are forecasting continued growth with our free report on analyst estimates for the company.
We have also put together a list of global stocks with a market capitalisation above $1bn and yielding more 3%.
If you spot an error that warrants correction, please contact the editor at editorial-team@simplywallst.com. This article by Simply Wall St is general in nature. It does not constitute a recommendation to buy or sell any stock, and does not take account of your objectives, or your financial situation. Simply Wall St has no position in the stocks mentioned.
We aim to bring you long-term focused research analysis driven by fundamental data. Note that our analysis may not factor in the latest price-sensitive company announcements or qualitative material. Thank you for reading.
