Before You Buy Manning & Napier Inc’s (NYSE:MN), Consider This

If you are a shareholder in Manning & Napier Inc’s (NYSE:MN), or are thinking about investing in the company, knowing how it contributes to the risk and reward profile of your portfolio is important. The beta measures MN’s exposure to the wider market risk, which reflects changes in economic and political factors. Different characteristics of a stock expose it to various levels of market risk, and the broad market index represents a beta value of one. Any stock with a beta of greater than one is considered more volatile than the market, and those with a beta less than one is generally less volatile.
See our latest analysis for Manning & Napier
An interpretation of MN’s beta
With a beta of 1.39, Manning & Napier is a stock that tends to experience more gains than the market during a growth phase and also a bigger reduction in value compared to the market during a broad downturn. According to this value of beta, MN can help magnify your portfolio return, especially if it is predominantly made up of low-beta stocks. If the market is going up, a higher exposure to the upside from a high-beta stock can push up your portfolio return.
How does MN’s size and industry impact its risk?
With a market cap of US$249.46M, MN falls within the small-cap spectrum of stocks, which are found to experience higher relative risk compared to larger companies. Moreover, MN’s industry, capital markets, is considered to be cyclical, which means it is more volatile than the market over the economic cycle. Therefore, investors may expect high beta associated with small companies, as well as those operating in the capital markets industry, relative to those more well-established firms in a more defensive industry. This is consistent with MN’s individual beta value we discussed above. Next, we will examine the fundamental factors which can cause cyclicality in the stock.
Is MN’s cost structure indicative of a high beta?
During times of economic downturn, low demand may cause companies to readjust production of their goods and services. It is more difficult for companies to lower their cost, if the majority of these costs are generated by fixed assets. Therefore, this is a type of risk which is associated with higher beta. I test MN’s ratio of fixed assets to total assets in order to determine how high the risk is associated with this type of constraint. Given that fixed assets make up less than a third of the company’s total assets, MN doesn’t rely heavily upon these expensive, inflexible assets to run its business during downturns. As a result, the company may be less volatile relative to broad market movements, compared to a company of similar size but higher proportion of fixed assets. However, this is the opposite to what MN’s actual beta value suggests, which is higher stock volatility relative to the market.
What this means for you:
You may reap the gains of MN’s returns during times of economic growth by holding the stock. Its low fixed cost also implies that it has the flexibility to adjust its cost to preserve margins during times of a downturn. I recommend analysing the stock in terms of your current portfolio composition before deciding to invest more into MN. What I have not mentioned in my article here are important company-specific fundamentals such as Manning & Napier’s financial health and performance track record. I highly recommend you to complete your research by taking a look at the following:
Future Outlook: What are well-informed industry analysts predicting for MN’s future growth? Take a look at our free research report of analyst consensus for MN’s outlook.
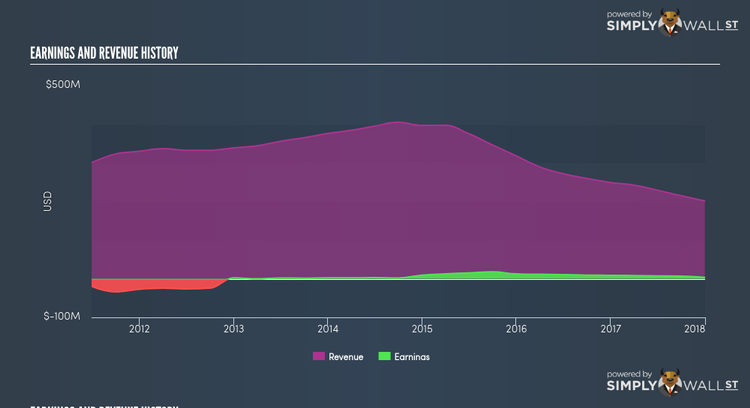
Past Track Record: Has MN been consistently performing well irrespective of the ups and downs in the market? Go into more detail in the past performance analysis and take a look at the free visual representations of MN’s historicals for more clarity.
Other High-Performing Stocks: Are there other stocks that provide better prospects with proven track records? Explore our free list of these great stocks here.
To help readers see pass the short term volatility of the financial market, we aim to bring you a long-term focused research analysis purely driven by fundamental data. Note that our analysis does not factor in the latest price sensitive company announcements.
The author is an independent contributor and at the time of publication had no position in the stocks mentioned.
