How Buzzi Unicem S.p.A.'s (BIT:BZU) Earnings Growth Stacks Up Against The Industry

After looking at Buzzi Unicem S.p.A.'s (BIT:BZU) latest earnings announcement (30 June 2019), I found it useful to revisit the company's performance in the past couple of years and assess this against the most recent figures. As a long-term investor I tend to focus on earnings trend, rather than a single number at one point in time. Also, comparing it against an industry benchmark to understand whether it outperformed, or is simply riding an industry wave, is a crucial aspect. Below is a brief commentary on my key takeaways.
View our latest analysis for Buzzi Unicem
Did BZU's recent performance beat its trend and industry?
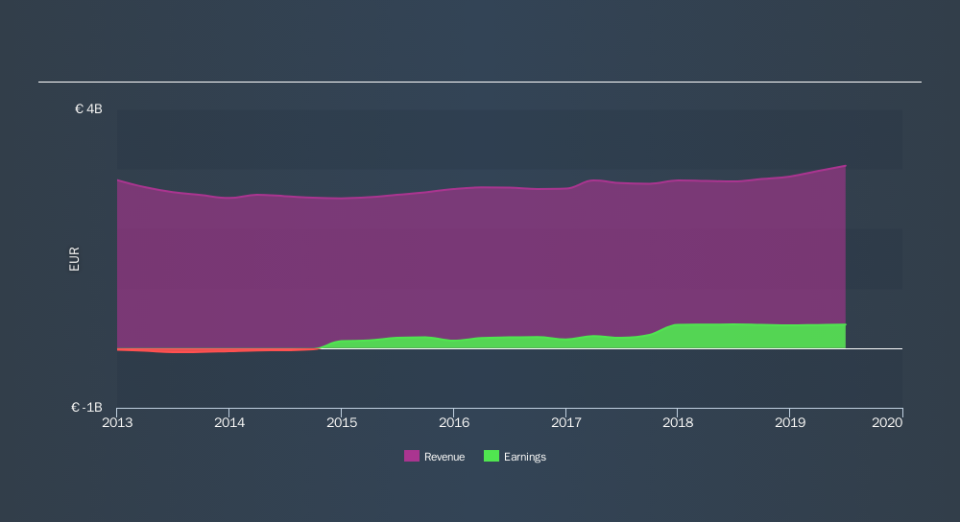
BZU's trailing twelve-month earnings (from 30 June 2019) of €394m has declined by -0.8% compared to the previous year.
Furthermore, this one-year growth rate has been lower than its average earnings growth rate over the past 5 years of 35%, indicating the rate at which BZU is growing has slowed down. What could be happening here? Let's examine what's occurring with margins and if the whole industry is feeling the heat.
In terms of returns from investment, Buzzi Unicem has fallen short of achieving a 20% return on equity (ROE), recording 12% instead. However, its return on assets (ROA) of 6.9% exceeds the IT Basic Materials industry of 6.0%, indicating Buzzi Unicem has used its assets more efficiently. And finally, its return on capital (ROC), which also accounts for Buzzi Unicem’s debt level, has increased over the past 3 years from 5.9% to 7.3%. This correlates with a decrease in debt holding, with debt-to-equity ratio declining from 70% to 39% over the past 5 years.
What does this mean?
While past data is useful, it doesn’t tell the whole story. Companies that are profitable, but have unpredictable earnings, can have many factors impacting its business. You should continue to research Buzzi Unicem to get a better picture of the stock by looking at:
Future Outlook: What are well-informed industry analysts predicting for BZU’s future growth? Take a look at our free research report of analyst consensus for BZU’s outlook.
Financial Health: Are BZU’s operations financially sustainable? Balance sheets can be hard to analyze, which is why we’ve done it for you. Check out our financial health checks here.
Other High-Performing Stocks: Are there other stocks that provide better prospects with proven track records? Explore our free list of these great stocks here.
NB: Figures in this article are calculated using data from the trailing twelve months from 30 June 2019. This may not be consistent with full year annual report figures.
We aim to bring you long-term focused research analysis driven by fundamental data. Note that our analysis may not factor in the latest price-sensitive company announcements or qualitative material.
If you spot an error that warrants correction, please contact the editor at editorial-team@simplywallst.com. This article by Simply Wall St is general in nature. It does not constitute a recommendation to buy or sell any stock, and does not take account of your objectives, or your financial situation. Simply Wall St has no position in the stocks mentioned. Thank you for reading.
