C.H. Robinson Worldwide, Inc. (NASDAQ:CHRW) Earns A Nice Return On Capital Employed

Today we'll look at C.H. Robinson Worldwide, Inc. (NASDAQ:CHRW) and reflect on its potential as an investment. To be precise, we'll consider its Return On Capital Employed (ROCE), as that will inform our view of the quality of the business.
First, we'll go over how we calculate ROCE. Second, we'll look at its ROCE compared to similar companies. Finally, we'll look at how its current liabilities affect its ROCE.
Return On Capital Employed (ROCE): What is it?
ROCE is a measure of a company's yearly pre-tax profit (its return), relative to the capital employed in the business. All else being equal, a better business will have a higher ROCE. In brief, it is a useful tool, but it is not without drawbacks. Renowned investment researcher Michael Mauboussin has suggested that a high ROCE can indicate that 'one dollar invested in the company generates value of more than one dollar'.
How Do You Calculate Return On Capital Employed?
The formula for calculating the return on capital employed is:
Return on Capital Employed = Earnings Before Interest and Tax (EBIT) ÷ (Total Assets - Current Liabilities)
Or for C.H. Robinson Worldwide:
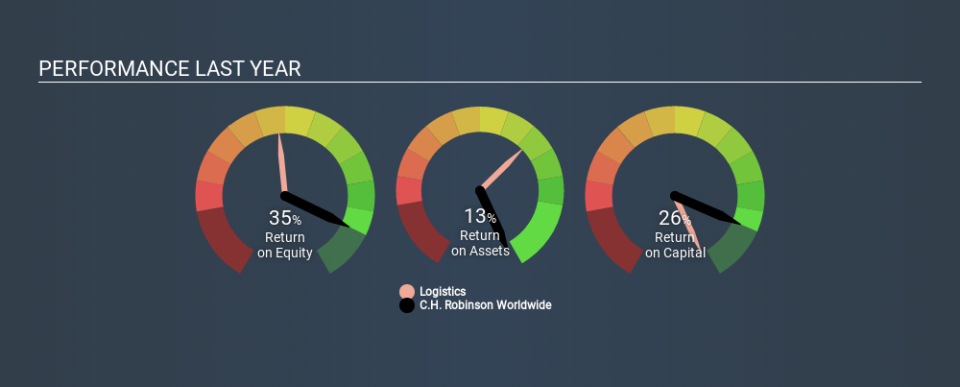
0.26 = US$790m ÷ (US$4.6b - US$1.6b) (Based on the trailing twelve months to December 2019.)
So, C.H. Robinson Worldwide has an ROCE of 26%.
See our latest analysis for C.H. Robinson Worldwide
Does C.H. Robinson Worldwide Have A Good ROCE?
One way to assess ROCE is to compare similar companies. In our analysis, C.H. Robinson Worldwide's ROCE is meaningfully higher than the 12% average in the Logistics industry. I think that's good to see, since it implies the company is better than other companies at making the most of its capital. Setting aside the comparison to its industry for a moment, C.H. Robinson Worldwide's ROCE in absolute terms currently looks quite high.
We can see that, C.H. Robinson Worldwide currently has an ROCE of 26%, less than the 45% it reported 3 years ago. So investors might consider if it has had issues recently. The image below shows how C.H. Robinson Worldwide's ROCE compares to its industry, and you can click it to see more detail on its past growth.
It is important to remember that ROCE shows past performance, and is not necessarily predictive. ROCE can be misleading for companies in cyclical industries, with returns looking impressive during the boom times, but very weak during the busts. ROCE is only a point-in-time measure. What happens in the future is pretty important for investors, so we have prepared a free report on analyst forecasts for C.H. Robinson Worldwide.
How C.H. Robinson Worldwide's Current Liabilities Impact Its ROCE
Current liabilities are short term bills and invoices that need to be paid in 12 months or less. The ROCE equation subtracts current liabilities from capital employed, so a company with a lot of current liabilities appears to have less capital employed, and a higher ROCE than otherwise. To check the impact of this, we calculate if a company has high current liabilities relative to its total assets.
C.H. Robinson Worldwide has total assets of US$4.6b and current liabilities of US$1.6b. As a result, its current liabilities are equal to approximately 34% of its total assets. A medium level of current liabilities boosts C.H. Robinson Worldwide's ROCE somewhat.
The Bottom Line On C.H. Robinson Worldwide's ROCE
Even so, it has a great ROCE, and could be an attractive prospect for further research. C.H. Robinson Worldwide looks strong on this analysis, but there are plenty of other companies that could be a good opportunity . Here is a free list of companies growing earnings rapidly.
I will like C.H. Robinson Worldwide better if I see some big insider buys. While we wait, check out this free list of growing companies with considerable, recent, insider buying.
If you spot an error that warrants correction, please contact the editor at editorial-team@simplywallst.com. This article by Simply Wall St is general in nature. It does not constitute a recommendation to buy or sell any stock, and does not take account of your objectives, or your financial situation. Simply Wall St has no position in the stocks mentioned.
We aim to bring you long-term focused research analysis driven by fundamental data. Note that our analysis may not factor in the latest price-sensitive company announcements or qualitative material. Thank you for reading.
