Can Cadence Design Systems, Inc.'s (NASDAQ:CDNS) ROE Continue To Surpass The Industry Average?

Want to participate in a short research study? Help shape the future of investing tools and you could win a $250 gift card!
One of the best investments we can make is in our own knowledge and skill set. With that in mind, this article will work through how we can use Return On Equity (ROE) to better understand a business. By way of learning-by-doing, we'll look at ROE to gain a better understanding of Cadence Design Systems, Inc. (NASDAQ:CDNS).
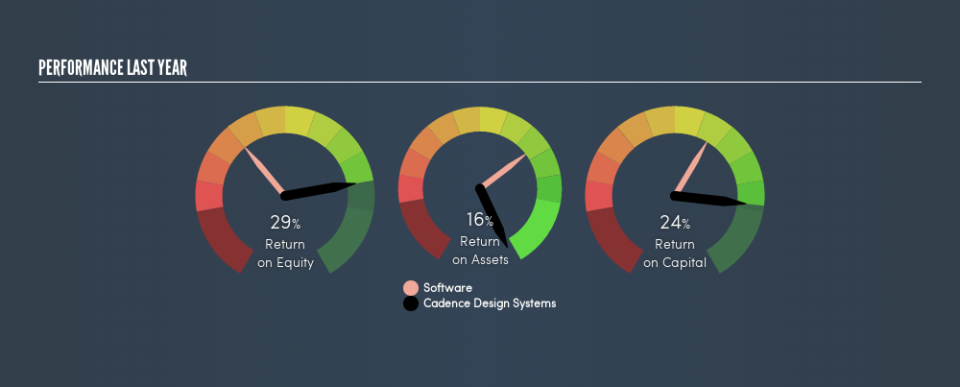
Cadence Design Systems has a ROE of 29%, based on the last twelve months. One way to conceptualize this, is that for each $1 of shareholders' equity it has, the company made $0.29 in profit.
View our latest analysis for Cadence Design Systems
How Do I Calculate Return On Equity?
The formula for return on equity is:
Return on Equity = Net Profit ÷ Shareholders' Equity
Or for Cadence Design Systems:
29% = US$393m ÷ US$1.4b (Based on the trailing twelve months to March 2019.)
Most know that net profit is the total earnings after all expenses, but the concept of shareholders' equity is a little more complicated. It is the capital paid in by shareholders, plus any retained earnings. The easiest way to calculate shareholders' equity is to subtract the company's total liabilities from the total assets.
What Does ROE Signify?
ROE looks at the amount a company earns relative to the money it has kept within the business. The 'return' is the yearly profit. A higher profit will lead to a higher ROE. So, all else equal, investors should like a high ROE. That means ROE can be used to compare two businesses.
Does Cadence Design Systems Have A Good ROE?
By comparing a company's ROE with its industry average, we can get a quick measure of how good it is. Importantly, this is far from a perfect measure, because companies differ significantly within the same industry classification. As you can see in the graphic below, Cadence Design Systems has a higher ROE than the average (9.7%) in the Software industry.
That's what I like to see. In my book, a high ROE almost always warrants a closer look. One data point to check is if insiders have bought shares recently.
How Does Debt Impact ROE?
Most companies need money -- from somewhere -- to grow their profits. That cash can come from issuing shares, retained earnings, or debt. In the first two cases, the ROE will capture this use of capital to grow. In the latter case, the debt required for growth will boost returns, but will not impact the shareholders' equity. Thus the use of debt can improve ROE, albeit along with extra risk in the case of stormy weather, metaphorically speaking.
Cadence Design Systems's Debt And Its 29% ROE
Cadence Design Systems has a debt to equity ratio of 0.29, which is far from excessive. When I see a high ROE, fuelled by only modest debt, I suspect the business is high quality. Careful use of debt to boost returns is often very good for shareholders. However, it could reduce the company's ability to take advantage of future opportunities.
The Key Takeaway
Return on equity is a useful indicator of the ability of a business to generate profits and return them to shareholders. In my book the highest quality companies have high return on equity, despite low debt. If two companies have the same ROE, then I would generally prefer the one with less debt.
But when a business is high quality, the market often bids it up to a price that reflects this. The rate at which profits are likely to grow, relative to the expectations of profit growth reflected in the current price, must be considered, too. So you might want to check this FREE visualization of analyst forecasts for the company.
If you would prefer check out another company -- one with potentially superior financials -- then do not miss this free list of interesting companies, that have HIGH return on equity and low debt.
We aim to bring you long-term focused research analysis driven by fundamental data. Note that our analysis may not factor in the latest price-sensitive company announcements or qualitative material.
If you spot an error that warrants correction, please contact the editor at editorial-team@simplywallst.com. This article by Simply Wall St is general in nature. It does not constitute a recommendation to buy or sell any stock, and does not take account of your objectives, or your financial situation. Simply Wall St has no position in the stocks mentioned. Thank you for reading.
