Is Canacol Energy Ltd’s (TSE:CNE) 14% ROCE Any Good?

Today we'll look at Canacol Energy Ltd (TSE:CNE) and reflect on its potential as an investment. To be precise, we'll consider its Return On Capital Employed (ROCE), as that will inform our view of the quality of the business.
First of all, we'll work out how to calculate ROCE. Then we'll compare its ROCE to similar companies. And finally, we'll look at how its current liabilities are impacting its ROCE.
Return On Capital Employed (ROCE): What is it?
ROCE measures the amount of pre-tax profits a company can generate from the capital employed in its business. Generally speaking a higher ROCE is better. Overall, it is a valuable metric that has its flaws. Author Edwin Whiting says to be careful when comparing the ROCE of different businesses, since 'No two businesses are exactly alike.'
How Do You Calculate Return On Capital Employed?
The formula for calculating the return on capital employed is:
Return on Capital Employed = Earnings Before Interest and Tax (EBIT) ÷ (Total Assets - Current Liabilities)
Or for Canacol Energy:
0.14 = US$87m ÷ (US$713m - US$68m) (Based on the trailing twelve months to June 2019.)
So, Canacol Energy has an ROCE of 14%.
Check out our latest analysis for Canacol Energy
Does Canacol Energy Have A Good ROCE?
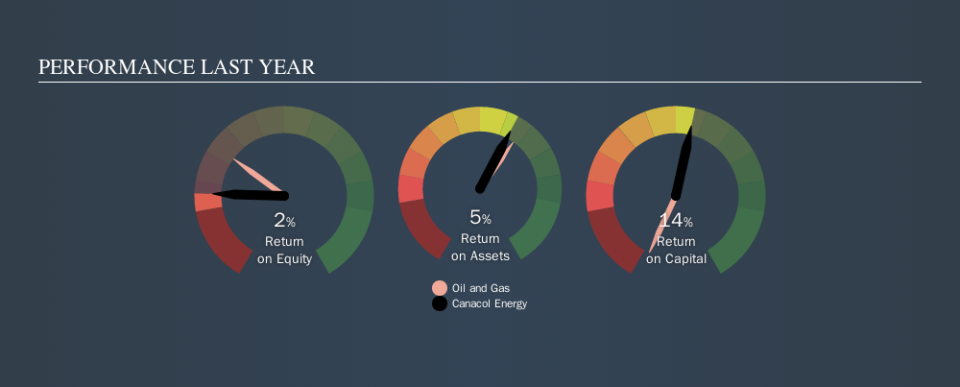
ROCE can be useful when making comparisons, such as between similar companies. Using our data, we find that Canacol Energy's ROCE is meaningfully better than the 5.6% average in the Oil and Gas industry. I think that's good to see, since it implies the company is better than other companies at making the most of its capital. Regardless of where Canacol Energy sits next to its industry, its ROCE in absolute terms appears satisfactory, and this company could be worth a closer look.
Canacol Energy delivered an ROCE of 14%, which is better than 3 years ago, as was making losses back then. That suggests the business has returned to profitability. You can click on the image below to see (in greater detail) how Canacol Energy's past growth compares to other companies.
It is important to remember that ROCE shows past performance, and is not necessarily predictive. ROCE can be misleading for companies in cyclical industries, with returns looking impressive during the boom times, but very weak during the busts. ROCE is, after all, simply a snap shot of a single year. We note Canacol Energy could be considered a cyclical business. Future performance is what matters, and you can see analyst predictions in our free report on analyst forecasts for the company.
What Are Current Liabilities, And How Do They Affect Canacol Energy's ROCE?
Short term (or current) liabilities, are things like supplier invoices, overdrafts, or tax bills that need to be paid within 12 months. Due to the way the ROCE equation works, having large bills due in the near term can make it look as though a company has less capital employed, and thus a higher ROCE than usual. To counteract this, we check if a company has high current liabilities, relative to its total assets.
Canacol Energy has total liabilities of US$68m and total assets of US$713m. Therefore its current liabilities are equivalent to approximately 9.6% of its total assets. In addition to low current liabilities (making a negligible impact on ROCE), Canacol Energy earns a sound return on capital employed.
What We Can Learn From Canacol Energy's ROCE
If it is able to keep this up, Canacol Energy could be attractive. Canacol Energy looks strong on this analysis, but there are plenty of other companies that could be a good opportunity . Here is a free list of companies growing earnings rapidly.
I will like Canacol Energy better if I see some big insider buys. While we wait, check out this free list of growing companies with considerable, recent, insider buying.
We aim to bring you long-term focused research analysis driven by fundamental data. Note that our analysis may not factor in the latest price-sensitive company announcements or qualitative material.
If you spot an error that warrants correction, please contact the editor at editorial-team@simplywallst.com. This article by Simply Wall St is general in nature. It does not constitute a recommendation to buy or sell any stock, and does not take account of your objectives, or your financial situation. Simply Wall St has no position in the stocks mentioned. Thank you for reading.
