Is Canadian National Railway Company's (TSE:CNR) High P/E Ratio A Problem For Investors?

The goal of this article is to teach you how to use price to earnings ratios (P/E ratios). We'll look at Canadian National Railway Company's (TSE:CNR) P/E ratio and reflect on what it tells us about the company's share price. Canadian National Railway has a price to earnings ratio of 19.97, based on the last twelve months. That corresponds to an earnings yield of approximately 5.0%.
View our latest analysis for Canadian National Railway
How Do I Calculate Canadian National Railway's Price To Earnings Ratio?
The formula for price to earnings is:
Price to Earnings Ratio = Price per Share ÷ Earnings per Share (EPS)
Or for Canadian National Railway:
P/E of 19.97 = CA$123.83 ÷ CA$6.20 (Based on the trailing twelve months to September 2019.)
Is A High P/E Ratio Good?
A higher P/E ratio implies that investors pay a higher price for the earning power of the business. That isn't necessarily good or bad, but a high P/E implies relatively high expectations of what a company can achieve in the future.
How Does Canadian National Railway's P/E Ratio Compare To Its Peers?
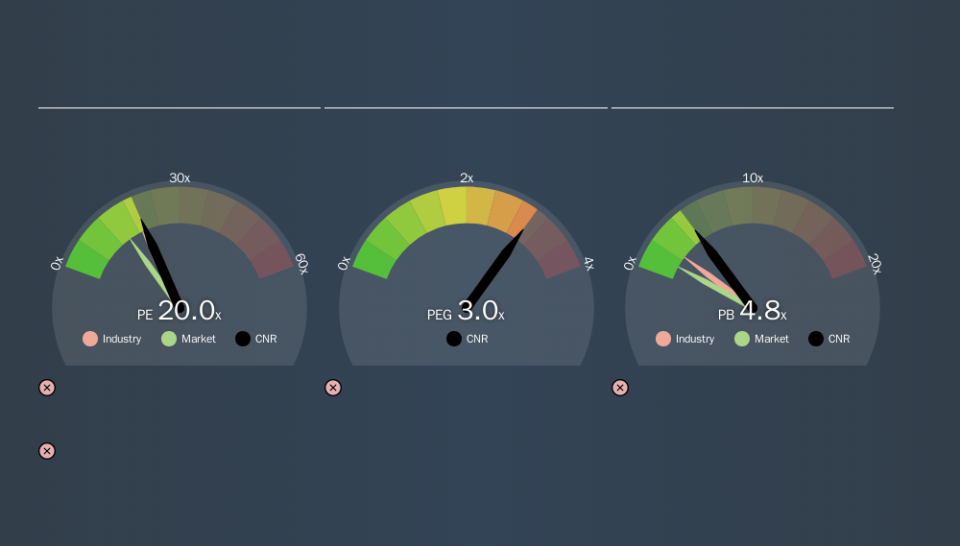
The P/E ratio indicates whether the market has higher or lower expectations of a company. The image below shows that Canadian National Railway has a P/E ratio that is roughly in line with the transportation industry average (19.1).
Its P/E ratio suggests that Canadian National Railway shareholders think that in the future it will perform about the same as other companies in its industry classification. The company could surprise by performing better than average, in the future. Further research into factors such as insider buying and selling, could help you form your own view on whether that is likely.
How Growth Rates Impact P/E Ratios
Earnings growth rates have a big influence on P/E ratios. Earnings growth means that in the future the 'E' will be higher. And in that case, the P/E ratio itself will drop rather quickly. So while a stock may look expensive based on past earnings, it could be cheap based on future earnings.
Canadian National Railway saw earnings per share decrease by 21% last year. But over the longer term (5 years) earnings per share have increased by 12%.
Remember: P/E Ratios Don't Consider The Balance Sheet
The 'Price' in P/E reflects the market capitalization of the company. In other words, it does not consider any debt or cash that the company may have on the balance sheet. The exact same company would hypothetically deserve a higher P/E ratio if it had a strong balance sheet, than if it had a weak one with lots of debt, because a cashed up company can spend on growth.
While growth expenditure doesn't always pay off, the point is that it is a good option to have; but one that the P/E ratio ignores.
So What Does Canadian National Railway's Balance Sheet Tell Us?
Net debt totals 15% of Canadian National Railway's market cap. That's enough debt to impact the P/E ratio a little; so keep it in mind if you're comparing it to companies without debt.
The Verdict On Canadian National Railway's P/E Ratio
Canadian National Railway trades on a P/E ratio of 20.0, which is above its market average of 14.6. With a bit of debt, but a lack of recent growth, it's safe to say the market is expecting improved profit performance from the company, in the next few years.
When the market is wrong about a stock, it gives savvy investors an opportunity. If the reality for a company is better than it expects, you can make money by buying and holding for the long term. So this free visual report on analyst forecasts could hold the key to an excellent investment decision.
Of course, you might find a fantastic investment by looking at a few good candidates. So take a peek at this free list of companies with modest (or no) debt, trading on a P/E below 20.
We aim to bring you long-term focused research analysis driven by fundamental data. Note that our analysis may not factor in the latest price-sensitive company announcements or qualitative material.
If you spot an error that warrants correction, please contact the editor at editorial-team@simplywallst.com. This article by Simply Wall St is general in nature. It does not constitute a recommendation to buy or sell any stock, and does not take account of your objectives, or your financial situation. Simply Wall St has no position in the stocks mentioned. Thank you for reading.
