Is Canadian Natural Resources Limited (TSE:CNQ) A Financially Sound Company?

Investors seeking to preserve capital in a volatile environment might consider large-cap stocks such as Canadian Natural Resources Limited (TSE:CNQ) a safer option. Risk-averse investors who are attracted to diversified streams of revenue and strong capital returns tend to seek out these large companies. However, the key to their continued success lies in its financial health. Today we will look at Canadian Natural Resources’s financial liquidity and debt levels, which are strong indicators for whether the company can weather economic downturns or fund strategic acquisitions for future growth. Note that this commentary is very high-level and solely focused on financial health, so I suggest you dig deeper yourself into CNQ here. See our latest analysis for Canadian Natural Resources
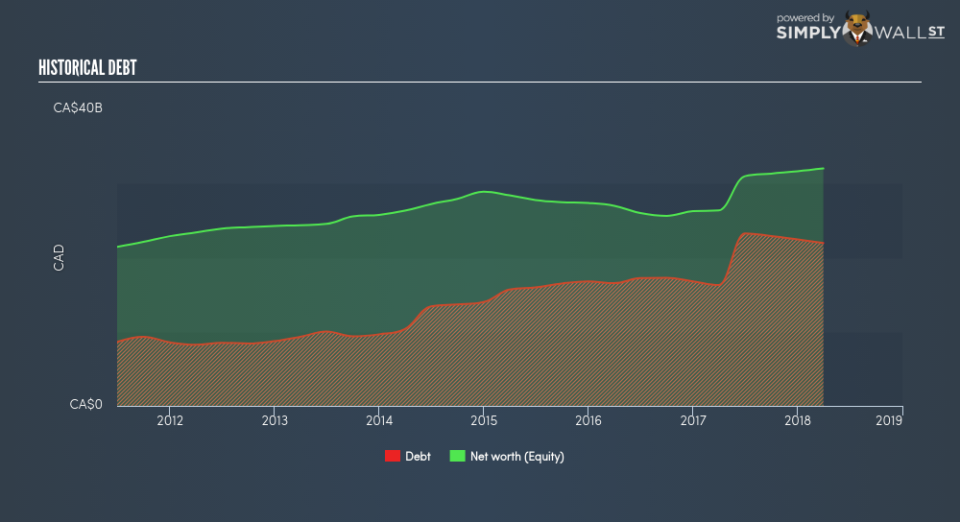
How much cash does CNQ generate through its operations?
CNQ has built up its total debt levels in the last twelve months, from CA$16.81b to CA$0 – this includes both the current and long-term debt. With this growth in debt, CNQ’s cash and short-term investments stands at CA$1.03b , ready to deploy into the business. On top of this, CNQ has produced cash from operations of CA$7.26b during the same period of time, leading to an operating cash to total debt ratio of 32.34%, signalling that CNQ’s operating cash is sufficient to cover its debt. This ratio can also be interpreted as a measure of efficiency as an alternative to return on assets. In CNQ’s case, it is able to generate 0.32x cash from its debt capital.
Does CNQ’s liquid assets cover its short-term commitments?
Looking at CNQ’s most recent CA$6.26b liabilities, it appears that the company is not able to meet these obligations given the level of current assets of CA$4.90b, with a current ratio of 0.78x below the prudent level of 3x.
Can CNQ service its debt comfortably?
CNQ is a relatively highly levered company with a debt-to-equity of 68.63%. This is common amongst large-cap companies because debt can often be a less expensive alternative to equity due to tax deductibility of interest payments. Accordingly, large companies often have an advantage over small-caps through lower cost of capital due to cheaper financing. By measuring how many times CNQ’s earnings can cover interest payments, we can evaluate whether its level of debt is sustainable or not. Net interest should be covered by earnings before interest and tax (EBIT) by at least three times to be safe. For CNQ, the ratio of 4.77x suggests that interest is appropriately covered. Strong interest coverage is seen as a responsible and safe practice, which highlights why most investors believe large-caps such as CNQ is a safe investment.
Next Steps:
CNQ’s high cash coverage means that, although its debt levels are high, the company is able to utilise its borrowings efficiently in order to generate cash flow. Though its lack of liquidity raises questions over current asset management practices for the large-cap. This is only a rough assessment of financial health, and I’m sure CNQ has company-specific issues impacting its capital structure decisions. I recommend you continue to research Canadian Natural Resources to get a better picture of the stock by looking at:
Future Outlook: What are well-informed industry analysts predicting for CNQ’s future growth? Take a look at our free research report of analyst consensus for CNQ’s outlook.
Valuation: What is CNQ worth today? Is the stock undervalued, even when its growth outlook is factored into its intrinsic value? The intrinsic value infographic in our free research report helps visualize whether CNQ is currently mispriced by the market.
Other High-Performing Stocks: Are there other stocks that provide better prospects with proven track records? Explore our free list of these great stocks here.
To help readers see pass the short term volatility of the financial market, we aim to bring you a long-term focused research analysis purely driven by fundamental data. Note that our analysis does not factor in the latest price sensitive company announcements.
The author is an independent contributor and at the time of publication had no position in the stocks mentioned.
