Canadian Natural Resources Limited (TSX:CNQ): Can It Deliver A Superior ROE To The Industry?

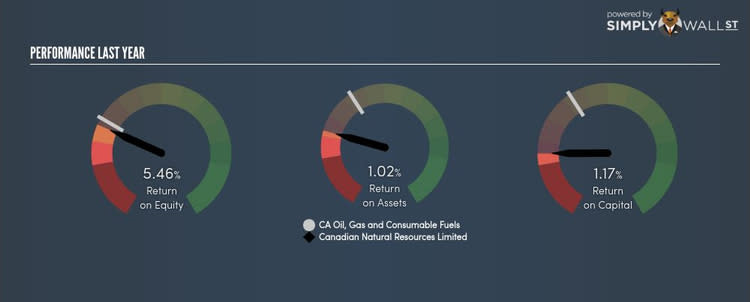
Canadian Natural Resources Limited’s (TSX:CNQ) most recent return on equity was a substandard 5.46% relative to its industry performance of 6.42% over the past year. Though CNQ's recent performance is underwhelming, it is useful to understand what ROE is made up of and how it should be interpreted. Knowing these components can change your views on CNQ's below-average returns. Today I will look at how components such as financial leverage can influence ROE which may impact the sustainability of CNQ's returns. View our latest analysis for Canadian Natural Resources
Breaking down ROE — the mother of all ratios
Return on Equity (ROE) weighs CNQ’s profit against the level of its shareholders’ equity. It essentially shows how much CNQ can generate in earnings given the amount of equity it has raised. Generally speaking, a higher ROE is preferred; however, there are other factors we must also consider before making any conclusions.
Return on Equity = Net Profit ÷ Shareholders Equity
ROE is measured against cost of equity in order to determine the efficiency of CNQ’s equity capital deployed. Its cost of equity is 8.49%. Since CNQ’s return does not cover its cost, with a difference of -3.03%, this means its current use of equity is not efficient and not sustainable. Very simply, CNQ pays more for its capital than what it generates in return. ROE can be split up into three useful ratios: net profit margin, asset turnover, and financial leverage. This is called the Dupont Formula:
Dupont Formula
ROE = profit margin × asset turnover × financial leverage
ROE = (annual net profit ÷ sales) × (sales ÷ assets) × (assets ÷ shareholders’ equity)
ROE = annual net profit ÷ shareholders’ equity
The first component is profit margin, which measures how much of sales is retained after the company pays for all its expenses. Asset turnover shows how much revenue CNQ can generate with its current asset base. Finally, financial leverage will be our main focus today. It shows how much of assets are funded by equity and can show how sustainable CNQ’s capital structure is. Since financial leverage can artificially inflate ROE, we need to look at how much debt CNQ currently has. At 75.12%, CNQ’s debt-to-equity ratio appears sensible and indicates its ROE is generated from its capacity to increase profit without a large debt burden.

What this means for you:
Are you a shareholder? CNQ exhibits a weak ROE against its peers, as well as insufficient levels to cover its own cost of equity this year. Since its existing ROE is not fuelled by unsustainable debt, investors shouldn’t give up as CNQ still has capacity to improve shareholder returns by borrowing to invest in new projects in the future.
Are you a potential investor? If you are considering investing in CNQ, basing your decision on ROE alone is certainly not sufficient. I recommend you do additional fundamental analysis by looking through our most recent infographic report on Canadian Natural Resources to help you make a more informed investment decision. If you are not interested in CNQ anymore, you can use our free platform to see our list of stocks with Return on Equity over 20%.
To help readers see pass the short term volatility of the financial market, we aim to bring you a long-term focused research analysis purely driven by fundamental data. Note that our analysis does not factor in the latest price sensitive company announcements.
The author is an independent contributor and at the time of publication had no position in the stocks mentioned.
