Is Canterbury Park Holding Corporation's (NASDAQ:CPHC) P/E Ratio Really That Good?

Want to participate in a short research study? Help shape the future of investing tools and you could win a $250 gift card!
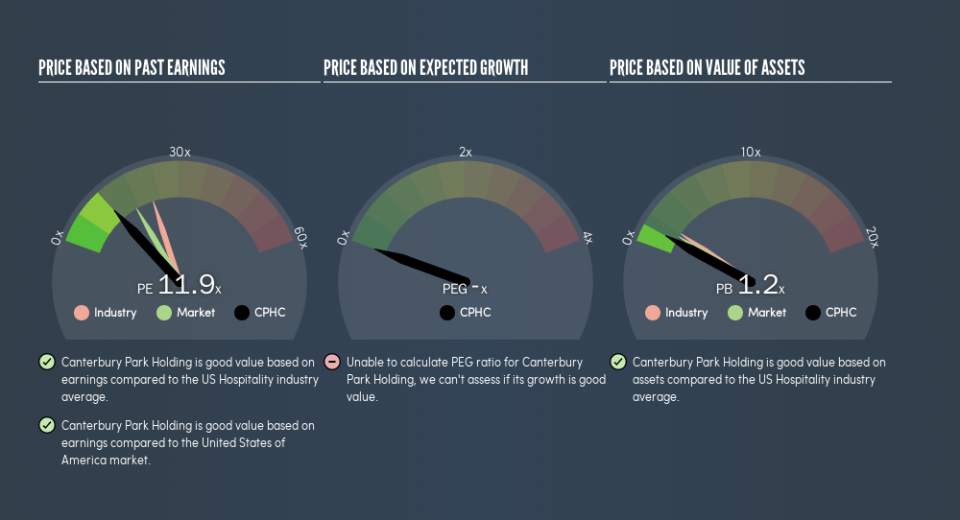
The goal of this article is to teach you how to use price to earnings ratios (P/E ratios). To keep it practical, we'll show how Canterbury Park Holding Corporation's (NASDAQ:CPHC) P/E ratio could help you assess the value on offer. Canterbury Park Holding has a price to earnings ratio of 11.87, based on the last twelve months. That is equivalent to an earnings yield of about 8.4%.
Check out our latest analysis for Canterbury Park Holding
How Do I Calculate A Price To Earnings Ratio?
The formula for price to earnings is:
Price to Earnings Ratio = Price per Share ÷ Earnings per Share (EPS)
Or for Canterbury Park Holding:
P/E of 11.87 = $12.59 ÷ $1.06 (Based on the trailing twelve months to March 2019.)
Is A High Price-to-Earnings Ratio Good?
A higher P/E ratio implies that investors pay a higher price for the earning power of the business. That is not a good or a bad thing per se, but a high P/E does imply buyers are optimistic about the future.
How Growth Rates Impact P/E Ratios
Earnings growth rates have a big influence on P/E ratios. Earnings growth means that in the future the 'E' will be higher. That means even if the current P/E is high, it will reduce over time if the share price stays flat. And as that P/E ratio drops, the company will look cheap, unless its share price increases.
Canterbury Park Holding increased earnings per share by 2.3% last year. And earnings per share have improved by 31% annually, over the last five years.
Does Canterbury Park Holding Have A Relatively High Or Low P/E For Its Industry?
One good way to get a quick read on what market participants expect of a company is to look at its P/E ratio. If you look at the image below, you can see Canterbury Park Holding has a lower P/E than the average (22.1) in the hospitality industry classification.
Its relatively low P/E ratio indicates that Canterbury Park Holding shareholders think it will struggle to do as well as other companies in its industry classification. While current expectations are low, the stock could be undervalued if the situation is better than the market assumes. You should delve deeper. I like to check if company insiders have been buying or selling.
A Limitation: P/E Ratios Ignore Debt and Cash In The Bank
One drawback of using a P/E ratio is that it considers market capitalization, but not the balance sheet. In other words, it does not consider any debt or cash that the company may have on the balance sheet. In theory, a company can lower its future P/E ratio by using cash or debt to invest in growth.
Spending on growth might be good or bad a few years later, but the point is that the P/E ratio does not account for the option (or lack thereof).
How Does Canterbury Park Holding's Debt Impact Its P/E Ratio?
Since Canterbury Park Holding holds net cash of US$448k, it can spend on growth, justifying a higher P/E ratio than otherwise.
The Bottom Line On Canterbury Park Holding's P/E Ratio
Canterbury Park Holding trades on a P/E ratio of 11.9, which is below the US market average of 17.1. Recent earnings growth wasn't bad. And the healthy balance sheet means the company can sustain growth while the P/E suggests shareholders don't think it will.
When the market is wrong about a stock, it gives savvy investors an opportunity. As value investor Benjamin Graham famously said, 'In the short run, the market is a voting machine but in the long run, it is a weighing machine.' We don't have analyst forecasts, but shareholders might want to examine this detailed historical graph of earnings, revenue and cash flow.
Of course you might be able to find a better stock than Canterbury Park Holding. So you may wish to see this free collection of other companies that have grown earnings strongly.
We aim to bring you long-term focused research analysis driven by fundamental data. Note that our analysis may not factor in the latest price-sensitive company announcements or qualitative material.
If you spot an error that warrants correction, please contact the editor at editorial-team@simplywallst.com. This article by Simply Wall St is general in nature. It does not constitute a recommendation to buy or sell any stock, and does not take account of your objectives, or your financial situation. Simply Wall St has no position in the stocks mentioned. Thank you for reading.
