Here’s What Cathay General Bancorp’s (NASDAQ:CATY) P/E Ratio Is Telling Us

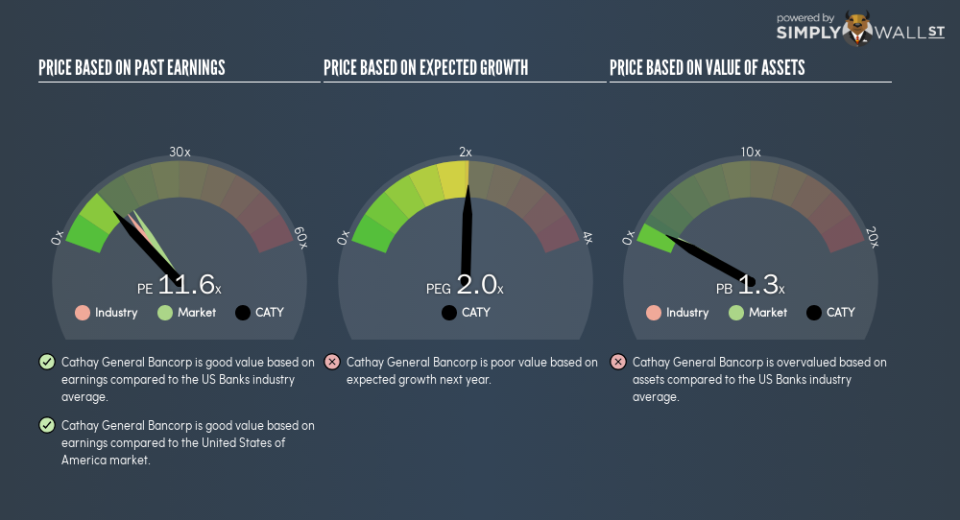
The goal of this article is to teach you how to use price to earnings ratios (P/E ratios). We’ll look at Cathay General Bancorp’s (NASDAQ:CATY) P/E ratio and reflect on what it tells us about the company’s share price. Cathay General Bancorp has a P/E ratio of 11.63, based on the last twelve months. That is equivalent to an earnings yield of about 8.6%.
View our latest analysis for Cathay General Bancorp
How Do You Calculate A P/E Ratio?
The formula for price to earnings is:
Price to Earnings Ratio = Share Price ÷ Earnings per Share (EPS)
Or for Cathay General Bancorp:
P/E of 11.63 = $33.44 ÷ $2.87 (Based on the year to September 2018.)
Is A High Price-to-Earnings Ratio Good?
A higher P/E ratio means that investors are paying a higher price for each $1 of company earnings. That isn’t a good or a bad thing on its own, but a high P/E means that buyers have a higher opinion of the business’s prospects, relative to stocks with a lower P/E.
How Growth Rates Impact P/E Ratios
P/E ratios primarily reflect market expectations around earnings growth rates. Earnings growth means that in the future the ‘E’ will be higher. Therefore, even if you pay a high multiple of earnings now, that multiple will become lower in the future. Then, a lower P/E should attract more buyers, pushing the share price up.
Cathay General Bancorp increased earnings per share by an impressive 16% over the last twelve months. And earnings per share have improved by 12% annually, over the last five years. With that performance, you might expect an above average P/E ratio.
How Does Cathay General Bancorp’s P/E Ratio Compare To Its Peers?
The P/E ratio essentially measures market expectations of a company. The image below shows that Cathay General Bancorp has a lower P/E than the average (14.1) P/E for companies in the banks industry.
This suggests that market participants think Cathay General Bancorp will underperform other companies in its industry. Since the market seems unimpressed with Cathay General Bancorp, it’s quite possible it could surprise on the upside. You should delve deeper. I like to check if company insiders have been buying or selling.
Don’t Forget: The P/E Does Not Account For Debt or Bank Deposits
The ‘Price’ in P/E reflects the market capitalization of the company. That means it doesn’t take debt or cash into account. In theory, a company can lower its future P/E ratio by using cash or debt to invest in growth.
Such spending might be good or bad, overall, but the key point here is that you need to look at debt to understand the P/E ratio in context.
Cathay General Bancorp’s Balance Sheet
The extra options and safety that comes with Cathay General Bancorp’s US$54m net cash position means that it deserves a higher P/E than it would if it had a lot of net debt.
The Bottom Line On Cathay General Bancorp’s P/E Ratio
Cathay General Bancorp trades on a P/E ratio of 11.6, which is below the US market average of 16. Not only should the net cash position reduce risk, but the recent growth has been impressive. The below average P/E ratio suggests that market participants don’t believe the strong growth will continue. Since analysts are predicting growth will continue, one might expect to see a higher P/E so it may be worth looking closer.
Investors have an opportunity when market expectations about a stock are wrong. If the reality for a company is not as bad as the P/E ratio indicates, then the share price should increase as the market realizes this. So this free visualization of the analyst consensus on future earnings could help you make the right decision about whether to buy, sell, or hold.
Of course you might be able to find a better stock than Cathay General Bancorp. So you may wish to see this free collection of other companies that have grown earnings strongly.
To help readers see past the short term volatility of the financial market, we aim to bring you a long-term focused research analysis purely driven by fundamental data. Note that our analysis does not factor in the latest price-sensitive company announcements.
The author is an independent contributor and at the time of publication had no position in the stocks mentioned. For errors that warrant correction please contact the editor at editorial-team@simplywallst.com.
