Should We Be Cautious About Clinigen Group Plc’s (LON:CLIN) ROE Of 7.8%?

Want to participate in a short research study? Help shape the future of investing tools and you could win a $250 gift card!
One of the best investments we can make is in our own knowledge and skill set. With that in mind, this article will work through how we can use Return On Equity (ROE) to better understand a business. To keep the lesson grounded in practicality, we’ll use ROE to better understand Clinigen Group Plc (LON:CLIN).
Our data shows Clinigen Group has a return on equity of 7.8% for the last year. Another way to think of that is that for every £1 worth of equity in the company, it was able to earn £0.078.
See our latest analysis for Clinigen Group
How Do I Calculate Return On Equity?
The formula for return on equity is:
Return on Equity = Net Profit ÷ Shareholders’ Equity
Or for Clinigen Group:
7.8% = 27.4 ÷ UK£350m (Based on the trailing twelve months to June 2018.)
It’s easy to understand the ‘net profit’ part of that equation, but ‘shareholders’ equity’ requires further explanation. It is all earnings retained by the company, plus any capital paid in by shareholders. The easiest way to calculate shareholders’ equity is to subtract the company’s total liabilities from the total assets.
What Does Return On Equity Signify?
ROE measures a company’s profitability against the profit it retains, and any outside investments. The ‘return’ is the profit over the last twelve months. That means that the higher the ROE, the more profitable the company is. So, as a general rule, a high ROE is a good thing. That means it can be interesting to compare the ROE of different companies.
Does Clinigen Group Have A Good ROE?
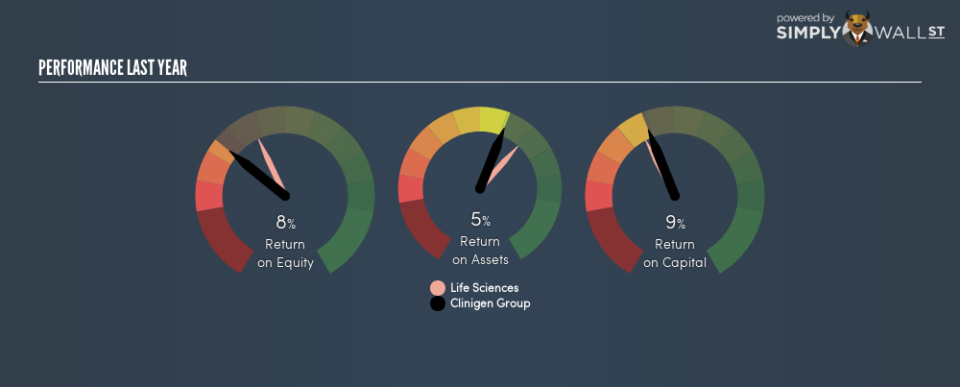
Arguably the easiest way to assess company’s ROE is to compare it with the average in its industry. The limitation of this approach is that some companies are quite different from others, even within the same industry classification. If you look at the image below, you can see Clinigen Group has a lower ROE than the average (12%) in the Life Sciences industry classification.
Unfortunately, that’s sub-optimal. We prefer it when the ROE of a company is above the industry average, but it’s not the be-all and end-all if it is lower. Nonetheless, it could be useful to double-check if insiders have sold shares recently.
Why You Should Consider Debt When Looking At ROE
Virtually all companies need money to invest in the business, to grow profits. The cash for investment can come from prior year profits (retained earnings), issuing new shares, or borrowing. In the case of the first and second options, the ROE will reflect this use of cash, for growth. In the latter case, the use of debt will improve the returns, but will not change the equity. In this manner the use of debt will boost ROE, even though the core economics of the business stay the same.
Combining Clinigen Group’s Debt And Its 7.8% Return On Equity
Although Clinigen Group does use debt, its debt to equity ratio of 0.49 is still low. I’m not impressed with its ROE, but the debt levels are not too high, indicating the business has decent prospects. Judicious use of debt to improve returns can certainly be a good thing, although it does elevate risk slightly and reduce future optionality.
The Bottom Line On ROE
Return on equity is one way we can compare the business quality of different companies. A company that can achieve a high return on equity without debt could be considered a high quality business. All else being equal, a higher ROE is better.
But ROE is just one piece of a bigger puzzle, since high quality businesses often trade on high multiples of earnings. The rate at which profits are likely to grow, relative to the expectations of profit growth reflected in the current price, must be considered, too. So you might want to check this FREE visualization of analyst forecasts for the company.
Of course, you might find a fantastic investment by looking elsewhere. So take a peek at this free list of interesting companies.
To help readers see past the short term volatility of the financial market, we aim to bring you a long-term focused research analysis purely driven by fundamental data. Note that our analysis does not factor in the latest price-sensitive company announcements.
The author is an independent contributor and at the time of publication had no position in the stocks mentioned. For errors that warrant correction please contact the editor at editorial-team@simplywallst.com.
