Is Cerner Corporation’s (NASDAQ:CERN) Balance Sheet Strong Enough To Weather A Storm?

There are a number of reasons that attract investors towards large-cap companies such as Cerner Corporation (NASDAQ:CERN), with a market cap of US$19.90B. Big corporations are much sought after by risk-averse investors who find diversified revenue streams and strong capital returns attractive. However, the health of the financials determines whether the company continues to succeed. This article will examine Cerner’s financial liquidity and debt levels to get an idea of whether the company can deal with cyclical downturns and maintain funds to accommodate strategic spending for future growth. Remember this is a very top-level look that focuses exclusively on financial health, so I recommend a deeper analysis into CERN here. Check out our latest analysis for Cerner
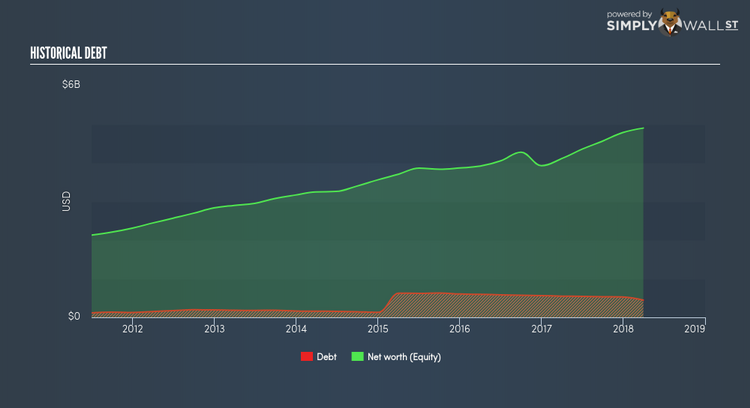
How does CERN’s operating cash flow stack up against its debt?
Over the past year, CERN has reduced its debt from US$563.75M to US$526.72M – this includes both the current and long-term debt. With this reduction in debt, CERN’s cash and short-term investments stands at US$805.77M for investing into the business. Additionally, CERN has generated cash from operations of US$1.31B in the last twelve months, leading to an operating cash to total debt ratio of 248.27%, meaning that CERN’s current level of operating cash is high enough to cover debt. This ratio can also be a sign of operational efficiency as an alternative to return on assets. In CERN’s case, it is able to generate 2.48x cash from its debt capital.
Can CERN meet its short-term obligations with the cash in hand?
With current liabilities at US$789.60M, the company has been able to meet these obligations given the level of current assets of US$2.38B, with a current ratio of 3.01x. Though, anything above 3x is considered high and could mean that CERN has too much idle capital in low-earning investments.
Can CERN service its debt comfortably?
A debt-to-equity ratio threshold varies depending on what industry the company operates, since some requires more debt financing than others. As a rule of thumb, a financially healthy large-cap should have a ratio less than 40%. With debt at 9.09% of equity, CERN may be thought of as having low leverage. CERN is not taking on too much debt commitment, which can be restrictive and risky for equity-holders.
Next Steps:
CERN’s high cash coverage and low debt levels indicate its ability to utilise its borrowings efficiently in order to generate ample cash flow. In addition to this, the company exhibits proper management of current assets and upcoming liabilities. I admit this is a fairly basic analysis for CERN’s financial health. Other important fundamentals need to be considered alongside. You should continue to research Cerner to get a more holistic view of the stock by looking at:
Future Outlook: What are well-informed industry analysts predicting for CERN’s future growth? Take a look at our free research report of analyst consensus for CERN’s outlook.
Valuation: What is CERN worth today? Is the stock undervalued, even when its growth outlook is factored into its intrinsic value? The intrinsic value infographic in our free research report helps visualize whether CERN is currently mispriced by the market.
Other High-Performing Stocks: Are there other stocks that provide better prospects with proven track records? Explore our free list of these great stocks here.
To help readers see pass the short term volatility of the financial market, we aim to bring you a long-term focused research analysis purely driven by fundamental data. Note that our analysis does not factor in the latest price sensitive company announcements.
The author is an independent contributor and at the time of publication had no position in the stocks mentioned.
