Champions Oncology, Inc. (NASDAQ:CSBR) Delivered A Weaker ROE Than Its Industry

Many investors are still learning about the various metrics that can be useful when analysing a stock. This article is for those who would like to learn about Return On Equity (ROE). By way of learning-by-doing, we'll look at ROE to gain a better understanding of Champions Oncology, Inc. (NASDAQ:CSBR).
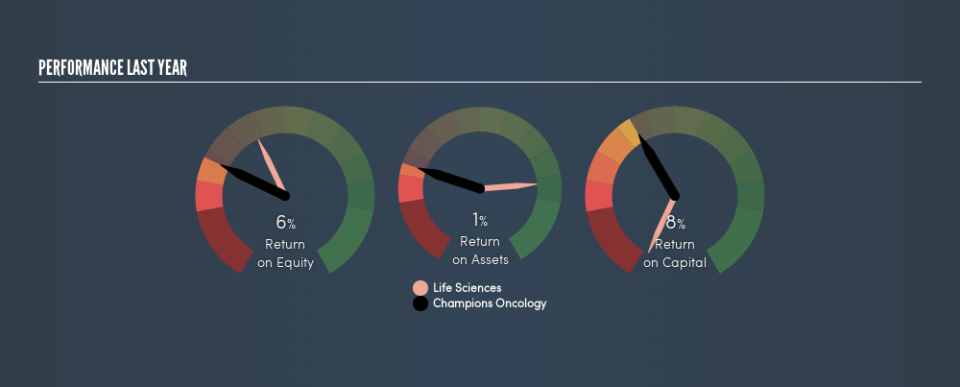
Over the last twelve months Champions Oncology has recorded a ROE of 5.7%. Another way to think of that is that for every $1 worth of equity in the company, it was able to earn $0.057.
See our latest analysis for Champions Oncology
How Do You Calculate Return On Equity?
The formula for ROE is:
Return on Equity = Net Profit ÷ Shareholders' Equity
Or for Champions Oncology:
5.7% = US$128k ÷ US$2.2m (Based on the trailing twelve months to April 2019.)
Most readers would understand what net profit is, but it’s worth explaining the concept of shareholders’ equity. It is all the money paid into the company from shareholders, plus any earnings retained. You can calculate shareholders' equity by subtracting the company's total liabilities from its total assets.
What Does ROE Mean?
ROE measures a company's profitability against the profit it retains, and any outside investments. The 'return' is the yearly profit. The higher the ROE, the more profit the company is making. So, all else equal, investors should like a high ROE. That means it can be interesting to compare the ROE of different companies.
Does Champions Oncology Have A Good ROE?
One simple way to determine if a company has a good return on equity is to compare it to the average for its industry. Importantly, this is far from a perfect measure, because companies differ significantly within the same industry classification. If you look at the image below, you can see Champions Oncology has a lower ROE than the average (12%) in the Life Sciences industry classification.
Unfortunately, that's sub-optimal. We'd prefer see an ROE above the industry average, but it might not matter if the company is undervalued. Nonetheless, it might be wise to check if insiders have been selling.
How Does Debt Impact Return On Equity?
Most companies need money -- from somewhere -- to grow their profits. The cash for investment can come from prior year profits (retained earnings), issuing new shares, or borrowing. In the first two cases, the ROE will capture this use of capital to grow. In the latter case, the use of debt will improve the returns, but will not change the equity. In this manner the use of debt will boost ROE, even though the core economics of the business stay the same.
Combining Champions Oncology's Debt And Its 5.7% Return On Equity
While Champions Oncology does have a tiny amount of debt, with debt to equity of just 0.0071, we think the use of debt is very modest. Although the ROE isn't overly impressive, the debt load is modest, suggesting the business has potential. Conservative use of debt to boost returns is usually a good move for shareholders, though it does leave the company more exposed to interest rate rises.
The Key Takeaway
Return on equity is one way we can compare the business quality of different companies. In my book the highest quality companies have high return on equity, despite low debt. If two companies have the same ROE, then I would generally prefer the one with less debt.
Having said that, while ROE is a useful indicator of business quality, you'll have to look at a whole range of factors to determine the right price to buy a stock. Profit growth rates, versus the expectations reflected in the price of the stock, are a particularly important to consider. So I think it may be worth checking this free report on analyst forecasts for the company.
If you would prefer check out another company -- one with potentially superior financials -- then do not miss this free list of interesting companies, that have HIGH return on equity and low debt.
We aim to bring you long-term focused research analysis driven by fundamental data. Note that our analysis may not factor in the latest price-sensitive company announcements or qualitative material.
If you spot an error that warrants correction, please contact the editor at editorial-team@simplywallst.com. This article by Simply Wall St is general in nature. It does not constitute a recommendation to buy or sell any stock, and does not take account of your objectives, or your financial situation. Simply Wall St has no position in the stocks mentioned. Thank you for reading.
