Are Check Point Software Technologies Ltd.’s (NASDAQ:CHKP) High Returns Really That Great?

Today we are going to look at Check Point Software Technologies Ltd. (NASDAQ:CHKP) to see whether it might be an attractive investment prospect. To be precise, we'll consider its Return On Capital Employed (ROCE), as that will inform our view of the quality of the business.
First, we'll go over how we calculate ROCE. Then we'll compare its ROCE to similar companies. Then we'll determine how its current liabilities are affecting its ROCE.
What is Return On Capital Employed (ROCE)?
ROCE is a measure of a company's yearly pre-tax profit (its return), relative to the capital employed in the business. Generally speaking a higher ROCE is better. In brief, it is a useful tool, but it is not without drawbacks. Author Edwin Whiting says to be careful when comparing the ROCE of different businesses, since 'No two businesses are exactly alike.'
How Do You Calculate Return On Capital Employed?
Analysts use this formula to calculate return on capital employed:
Return on Capital Employed = Earnings Before Interest and Tax (EBIT) ÷ (Total Assets - Current Liabilities)
Or for Check Point Software Technologies:
0.20 = US$906m ÷ (US$5.8b - US$1.3b) (Based on the trailing twelve months to March 2019.)
Therefore, Check Point Software Technologies has an ROCE of 20%.
See our latest analysis for Check Point Software Technologies
Does Check Point Software Technologies Have A Good ROCE?
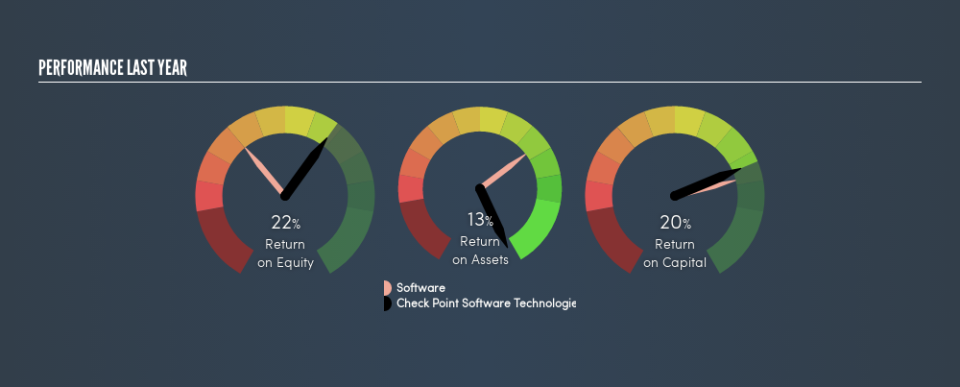
One way to assess ROCE is to compare similar companies. In our analysis, Check Point Software Technologies's ROCE is meaningfully higher than the 9.4% average in the Software industry. We would consider this a positive, as it suggests it is using capital more effectively than other similar companies. Separate from Check Point Software Technologies's performance relative to its industry, its ROCE in absolute terms looks satisfactory, and it may be worth researching in more depth.
You can click on the image below to see (in greater detail) how Check Point Software Technologies's past growth compares to other companies.
It is important to remember that ROCE shows past performance, and is not necessarily predictive. ROCE can be deceptive for cyclical businesses, as returns can look incredible in boom times, and terribly low in downturns. ROCE is, after all, simply a snap shot of a single year. What happens in the future is pretty important for investors, so we have prepared a free report on analyst forecasts for Check Point Software Technologies.
Check Point Software Technologies's Current Liabilities And Their Impact On Its ROCE
Liabilities, such as supplier bills and bank overdrafts, are referred to as current liabilities if they need to be paid within 12 months. The ROCE equation subtracts current liabilities from capital employed, so a company with a lot of current liabilities appears to have less capital employed, and a higher ROCE than otherwise. To counteract this, we check if a company has high current liabilities, relative to its total assets.
Check Point Software Technologies has total liabilities of US$1.3b and total assets of US$5.8b. Therefore its current liabilities are equivalent to approximately 22% of its total assets. A fairly low level of current liabilities is not influencing the ROCE too much.
What We Can Learn From Check Point Software Technologies's ROCE
Overall, Check Point Software Technologies has a decent ROCE and could be worthy of further research. Check Point Software Technologies shapes up well under this analysis, but it is far from the only business delivering excellent numbers . You might also want to check this free collection of companies delivering excellent earnings growth.
If you like to buy stocks alongside management, then you might just love this free list of companies. (Hint: insiders have been buying them).
We aim to bring you long-term focused research analysis driven by fundamental data. Note that our analysis may not factor in the latest price-sensitive company announcements or qualitative material.
If you spot an error that warrants correction, please contact the editor at editorial-team@simplywallst.com. This article by Simply Wall St is general in nature. It does not constitute a recommendation to buy or sell any stock, and does not take account of your objectives, or your financial situation. Simply Wall St has no position in the stocks mentioned. Thank you for reading.
