Check Point Software Technologies Ltd.'s (NASDAQ:CHKP) institutional shareholders had a great week as one-year returns increased after a 4.1% gain last week
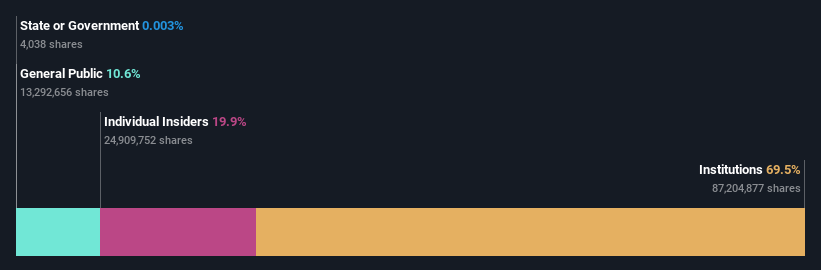
To get a sense of who is truly in control of Check Point Software Technologies Ltd. (NASDAQ:CHKP), it is important to understand the ownership structure of the business. With 70% stake, institutions possess the maximum shares in the company. Put another way, the group faces the maximum upside potential (or downside risk).
And things are looking up for institutional investors after the company gained US$641m in market cap last week. The one-year return on investment is currently 4.1% and last week's gain would have been more than welcomed.
Let's take a closer look to see what the different types of shareholders can tell us about Check Point Software Technologies.
See our latest analysis for Check Point Software Technologies
What Does The Institutional Ownership Tell Us About Check Point Software Technologies?
Many institutions measure their performance against an index that approximates the local market. So they usually pay more attention to companies that are included in major indices.
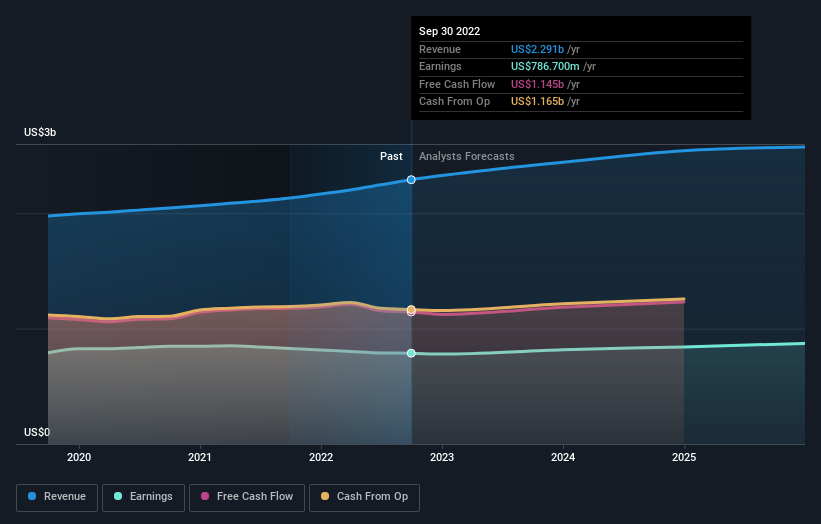
As you can see, institutional investors have a fair amount of stake in Check Point Software Technologies. This implies the analysts working for those institutions have looked at the stock and they like it. But just like anyone else, they could be wrong. It is not uncommon to see a big share price drop if two large institutional investors try to sell out of a stock at the same time. So it is worth checking the past earnings trajectory of Check Point Software Technologies, (below). Of course, keep in mind that there are other factors to consider, too.
Institutional investors own over 50% of the company, so together than can probably strongly influence board decisions. We note that hedge funds don't have a meaningful investment in Check Point Software Technologies. Looking at our data, we can see that the largest shareholder is the CEO Gil Shwed with 20% of shares outstanding. Meanwhile, the second and third largest shareholders, hold 6.1% and 5.1%, of the shares outstanding, respectively.
A closer look at our ownership figures suggests that the top 14 shareholders have a combined ownership of 51% implying that no single shareholder has a majority.
While it makes sense to study institutional ownership data for a company, it also makes sense to study analyst sentiments to know which way the wind is blowing. There are plenty of analysts covering the stock, so it might be worth seeing what they are forecasting, too.
Insider Ownership Of Check Point Software Technologies
The definition of company insiders can be subjective and does vary between jurisdictions. Our data reflects individual insiders, capturing board members at the very least. Company management run the business, but the CEO will answer to the board, even if he or she is a member of it.
Insider ownership is positive when it signals leadership are thinking like the true owners of the company. However, high insider ownership can also give immense power to a small group within the company. This can be negative in some circumstances.
Our information suggests that insiders maintain a significant holding in Check Point Software Technologies Ltd.. It has a market capitalization of just US$16b, and insiders have US$3.2b worth of shares in their own names. That's quite significant. Most would say this shows a good degree of alignment with shareholders, especially in a company of this size. You can click here to see if those insiders have been buying or selling.
General Public Ownership
With a 11% ownership, the general public, mostly comprising of individual investors, have some degree of sway over Check Point Software Technologies. While this size of ownership may not be enough to sway a policy decision in their favour, they can still make a collective impact on company policies.
Next Steps:
I find it very interesting to look at who exactly owns a company. But to truly gain insight, we need to consider other information, too.
Many find it useful to take an in depth look at how a company has performed in the past. You can access this detailed graph of past earnings, revenue and cash flow.
If you would prefer discover what analysts are predicting in terms of future growth, do not miss this free report on analyst forecasts.
NB: Figures in this article are calculated using data from the last twelve months, which refer to the 12-month period ending on the last date of the month the financial statement is dated. This may not be consistent with full year annual report figures.
Have feedback on this article? Concerned about the content? Get in touch with us directly. Alternatively, email editorial-team (at) simplywallst.com.
This article by Simply Wall St is general in nature. We provide commentary based on historical data and analyst forecasts only using an unbiased methodology and our articles are not intended to be financial advice. It does not constitute a recommendation to buy or sell any stock, and does not take account of your objectives, or your financial situation. We aim to bring you long-term focused analysis driven by fundamental data. Note that our analysis may not factor in the latest price-sensitive company announcements or qualitative material. Simply Wall St has no position in any stocks mentioned.
Join A Paid User Research Session
You’ll receive a US$30 Amazon Gift card for 1 hour of your time while helping us build better investing tools for the individual investors like yourself. Sign up here
