How Chesapeake Granite Wash Trust’s (CHKR) EPS Dropped -36.4%, Did Its Industry Show Weakness Too?

When Chesapeake Granite Wash Trust (NYSE:CHKR) released its most recent earnings update (30 September 2017), I compared it against two factor: its historical earnings track record, and the performance of its industry peers on average. Understanding how Chesapeake Granite Wash Trust performed requires a benchmark rather than trying to assess a standalone number at one point in time. Below is a quick commentary on how I see CHKR has performed. View our latest analysis for Chesapeake Granite Wash Trust
Was CHKR’s weak performance lately a part of a long-term decline?
I prefer to use data from the most recent 12 months, which annualizes the latest 6-month earnings release, or some times, the latest annual report is already the most recent financial data. This method allows me to assess many different companies on a similar basis, using new information. For Chesapeake Granite Wash Trust, the most recent bottom-line is $13M, which compared to the prior year’s figure, has plunged by a large -36.36%. Since these figures are relatively nearsighted, I have calculated an annualized five-year figure for Chesapeake Granite Wash Trust’s net income, which stands at $73M. This doesn’t look much better, as earnings seem to have steadily been falling over time.
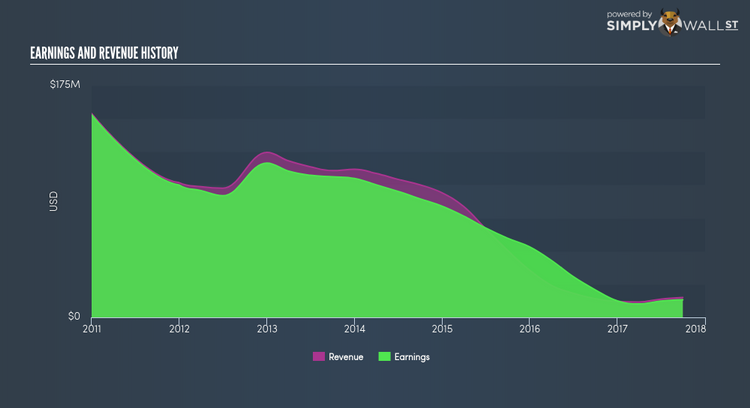
What could be happening here? Let’s examine what’s occurring with margins and whether the whole industry is facing the same headwind. Over the last few years, Chesapeake Granite Wash Trust has, on average, delivered negative top- and bottom-line growth. As revenues fell by more, expenses have been slashed in order to sustain margins – not the most sustainable operating activity. Looking at growth from a sector-level, the US oil, gas and consumable fuels industry has been growing, albeit, at a subdued single-digit rate of 3.71% in the previous year, . This is a change from a volatile drop of -10.80% in the past couple of years. This means that any headwind the industry is facing, it’s hitting Chesapeake Granite Wash Trust harder than its peers.
What does this mean?
Though Chesapeake Granite Wash Trust’s past data is helpful, it is only one aspect of my investment thesis. Usually companies that endure a prolonged period of diminishing earnings are going through some sort of reinvestment phase . However, if the whole industry is struggling to grow over time, it may be a indicator of a structural change, which makes Chesapeake Granite Wash Trust and its peers a riskier investment. I recommend you continue to research Chesapeake Granite Wash Trust to get a more holistic view of the stock by looking at:
1. Financial Health: Is CHKR’s operations financially sustainable? Balance sheets can be hard to analyze, which is why we’ve done it for you. Check out our financial health checks here.
2. Valuation: What is CHKR worth today? Is the stock undervalued, even when its growth outlook is factored into its intrinsic value? The intrinsic value infographic in our free research report helps visualize whether CHKR is currently mispriced by the market.
3. Other High-Performing Stocks: Are there other stocks that provide better prospects with proven track records? Explore our free list of these great stocks here.
NB: Figures in this article are calculated using data from the last twelve months, which refer to the 12-month period ending on the last date of the month the financial statement is dated. This may not be consistent with full year annual report figures.
To help readers see pass the short term volatility of the financial market, we aim to bring you a long-term focused research analysis purely driven by fundamental data. Note that our analysis does not factor in the latest price sensitive company announcements.
The author is an independent contributor and at the time of publication had no position in the stocks mentioned.
