China Silver Group Limited (HKG:815) Earns A Nice Return On Capital Employed

Today we'll evaluate China Silver Group Limited (HKG:815) to determine whether it could have potential as an investment idea. Specifically, we'll consider its Return On Capital Employed (ROCE), since that will give us an insight into how efficiently the business can generate profits from the capital it requires.
First up, we'll look at what ROCE is and how we calculate it. Next, we'll compare it to others in its industry. Finally, we'll look at how its current liabilities affect its ROCE.
Understanding Return On Capital Employed (ROCE)
ROCE measures the 'return' (pre-tax profit) a company generates from capital employed in its business. All else being equal, a better business will have a higher ROCE. Overall, it is a valuable metric that has its flaws. Author Edwin Whiting says to be careful when comparing the ROCE of different businesses, since 'No two businesses are exactly alike.'
So, How Do We Calculate ROCE?
Analysts use this formula to calculate return on capital employed:
Return on Capital Employed = Earnings Before Interest and Tax (EBIT) ÷ (Total Assets - Current Liabilities)
Or for China Silver Group:
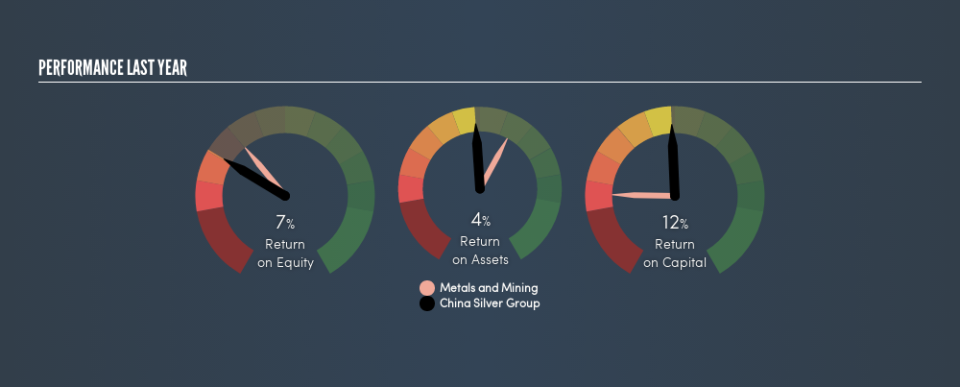
0.12 = CN¥395m ÷ (CN¥4.0b - CN¥637m) (Based on the trailing twelve months to December 2018.)
Therefore, China Silver Group has an ROCE of 12%.
See our latest analysis for China Silver Group
Is China Silver Group's ROCE Good?
ROCE is commonly used for comparing the performance of similar businesses. In our analysis, China Silver Group's ROCE is meaningfully higher than the 9.1% average in the Metals and Mining industry. I think that's good to see, since it implies the company is better than other companies at making the most of its capital. Separate from China Silver Group's performance relative to its industry, its ROCE in absolute terms looks satisfactory, and it may be worth researching in more depth.
In our analysis, China Silver Group's ROCE appears to be 12%, compared to 3 years ago, when its ROCE was 1.3%. This makes us think about whether the company has been reinvesting shrewdly.
Remember that this metric is backwards looking - it shows what has happened in the past, and does not accurately predict the future. ROCE can be misleading for companies in cyclical industries, with returns looking impressive during the boom times, but very weak during the busts. ROCE is, after all, simply a snap shot of a single year. Given the industry it operates in, China Silver Group could be considered cyclical. If China Silver Group is cyclical, it could make sense to check out this free graph of past earnings, revenue and cash flow.
What Are Current Liabilities, And How Do They Affect China Silver Group's ROCE?
Current liabilities include invoices, such as supplier payments, short-term debt, or a tax bill, that need to be paid within 12 months. The ROCE equation subtracts current liabilities from capital employed, so a company with a lot of current liabilities appears to have less capital employed, and a higher ROCE than otherwise. To check the impact of this, we calculate if a company has high current liabilities relative to its total assets.
China Silver Group has total liabilities of CN¥637m and total assets of CN¥4.0b. Therefore its current liabilities are equivalent to approximately 16% of its total assets. A fairly low level of current liabilities is not influencing the ROCE too much.
Our Take On China Silver Group's ROCE
This is good to see, and with a sound ROCE, China Silver Group could be worth a closer look. There might be better investments than China Silver Group out there, but you will have to work hard to find them . These promising businesses with rapidly growing earnings might be right up your alley.
If you are like me, then you will not want to miss this free list of growing companies that insiders are buying.
We aim to bring you long-term focused research analysis driven by fundamental data. Note that our analysis may not factor in the latest price-sensitive company announcements or qualitative material.
If you spot an error that warrants correction, please contact the editor at editorial-team@simplywallst.com. This article by Simply Wall St is general in nature. It does not constitute a recommendation to buy or sell any stock, and does not take account of your objectives, or your financial situation. Simply Wall St has no position in the stocks mentioned. Thank you for reading.
