Do You Like Chinney Kin Wing Holdings Limited (HKG:1556) At This P/E Ratio?

Want to participate in a research study? Help shape the future of investing tools and earn a $60 gift card!
The goal of this article is to teach you how to use price to earnings ratios (P/E ratios). We'll look at Chinney Kin Wing Holdings Limited's (HKG:1556) P/E ratio and reflect on what it tells us about the company's share price. Based on the last twelve months, Chinney Kin Wing Holdings's P/E ratio is 7.55. In other words, at today's prices, investors are paying HK$7.55 for every HK$1 in prior year profit.
See our latest analysis for Chinney Kin Wing Holdings
How Do I Calculate A Price To Earnings Ratio?
The formula for price to earnings is:
Price to Earnings Ratio = Price per Share ÷ Earnings per Share (EPS)
Or for Chinney Kin Wing Holdings:
P/E of 7.55 = HK$0.29 ÷ HK$0.038 (Based on the year to December 2018.)
Is A High P/E Ratio Good?
A higher P/E ratio implies that investors pay a higher price for the earning power of the business. That isn't necessarily good or bad, but a high P/E implies relatively high expectations of what a company can achieve in the future.
How Growth Rates Impact P/E Ratios
Companies that shrink earnings per share quickly will rapidly decrease the 'E' in the equation. That means even if the current P/E is low, it will increase over time if the share price stays flat. So while a stock may look cheap based on past earnings, it could be expensive based on future earnings.
Chinney Kin Wing Holdings shrunk earnings per share by 29% over the last year. And over the longer term (5 years) earnings per share have decreased 29% annually. This growth rate might warrant a below average P/E ratio.
How Does Chinney Kin Wing Holdings's P/E Ratio Compare To Its Peers?
We can get an indication of market expectations by looking at the P/E ratio. If you look at the image below, you can see Chinney Kin Wing Holdings has a lower P/E than the average (11.3) in the construction industry classification.
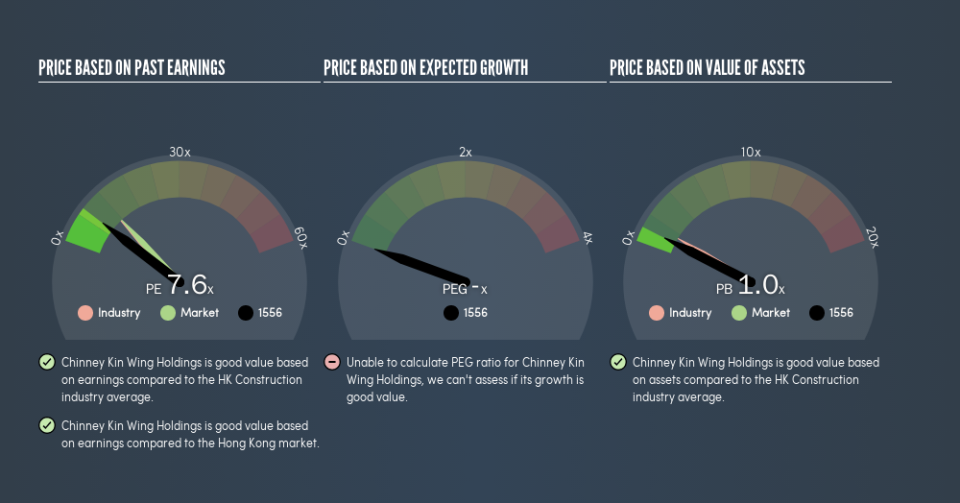
This suggests that market participants think Chinney Kin Wing Holdings will underperform other companies in its industry. Many investors like to buy stocks when the market is pessimistic about their prospects. If you consider the stock interesting, further research is recommended. For example, I often monitor director buying and selling.
A Limitation: P/E Ratios Ignore Debt and Cash In The Bank
The 'Price' in P/E reflects the market capitalization of the company. In other words, it does not consider any debt or cash that the company may have on the balance sheet. In theory, a company can lower its future P/E ratio by using cash or debt to invest in growth.
Such spending might be good or bad, overall, but the key point here is that you need to look at debt to understand the P/E ratio in context.
Chinney Kin Wing Holdings's Balance Sheet
The extra options and safety that comes with Chinney Kin Wing Holdings's HK$194m net cash position means that it deserves a higher P/E than it would if it had a lot of net debt.
The Bottom Line On Chinney Kin Wing Holdings's P/E Ratio
Chinney Kin Wing Holdings's P/E is 7.6 which is below average (11.8) in the HK market. Falling earnings per share are likely to be keeping potential buyers away, the relatively strong balance sheet will allow the company time to invest in growth. If it achieves that, then there's real potential that the low P/E could eventually indicate undervaluation.
Investors should be looking to buy stocks that the market is wrong about. If the reality for a company is not as bad as the P/E ratio indicates, then the share price should increase as the market realizes this. Although we don't have analyst forecasts, shareholders might want to examine this detailed historical graph of earnings, revenue and cash flow.
You might be able to find a better buy than Chinney Kin Wing Holdings. If you want a selection of possible winners, check out this free list of interesting companies that trade on a P/E below 20 (but have proven they can grow earnings).
We aim to bring you long-term focused research analysis driven by fundamental data. Note that our analysis may not factor in the latest price-sensitive company announcements or qualitative material.
If you spot an error that warrants correction, please contact the editor at editorial-team@simplywallst.com. This article by Simply Wall St is general in nature. It does not constitute a recommendation to buy or sell any stock, and does not take account of your objectives, or your financial situation. Simply Wall St has no position in the stocks mentioned. Thank you for reading.
