Citigroup Inc (C) Stock Is an Underappreciated Breakout Buy
InvestorPlace - Stock Market News, Stock Advice & Trading Tips
Bank stocks are back, baby. And can I just say, it’s about dang time. The Financial Sector SPDR Fund (NYSEARCA:XLF) has been dead money for months on end. Yesterday’s 1.15% gain for XLF bested every other sector and helped drive Citigroup Inc (NYSE:C) to a new 52-week high. C stock is breaking through major resistance, and opportunity is knocking.

Money is finally flocking to financials, and while the focus tends to be on the likes of Bank of America Corp (NYSE:BAC) and JPMorgan Chase & Co. (NYSE:JPM), I’d like to focus on the Big Four bank that tends not to get as much headline love: Citigroup.
Thursday’s optimism was driven in large part by the House’s passing of legislation designed to roll back many of the banking regulations instituted in the aftermath of the 2008 crisis. While the bill has yet to pass the Senate, there’s no doubt shining a spotlight on the banking sector put trader’s in a buying mood.
The pop in XLF appears to have ended its months of indecision.
As shown below, the fund was able to launch above the descending trendline that has defined its behavior for the past four months. It also closed above the 50-day moving average for the first time since March.

Source: OptionsAnalytix
It’s worth noting that the S&P Regional Banking ETF (NYSEARCA:KRE) also scored big gains on the day and should deliver further upside.
But as interesting as XLF and KRE are, it’s Citigroup that offers the best trade of the bunch. The reason, in short, is relative strength. We can illustrate Citigroup’s muscle flexing a few different ways.
First, consider where XLF and C lie in relation to their 52-week highs. Despite Thursday’s rally, the financial SPDR remains 6% below its late-February peak. Citigroup stock, on the other hand, just surged to a new high.
Source: OptionsAnalytix
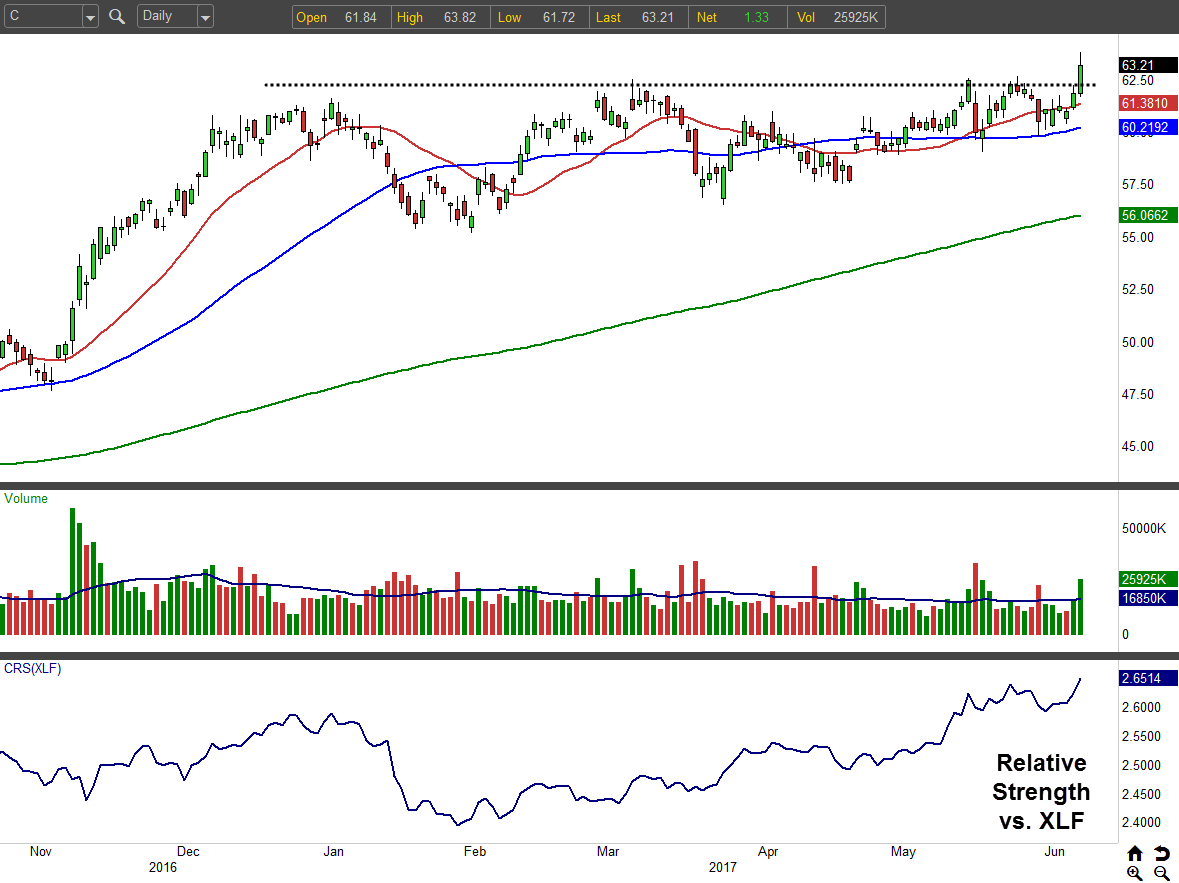
Now, if that doesn’t paint the picture, you can always turn to the Comparative Relative Strength (CRS) indicator. As shown in the daily chart of C, its relative strength has been trending higher virtually the entire year and just tagged a new high alongside the stock.
Bottom line: If you want to go with the best of breed in financials, Citigroup demands your attention.
On the price pattern front, C stock just completed an ascending triangle. The $62.50 ceiling is resistance no longer. The high volume accompanying yesterday’s breakout adds legitimacy to the move increasing the likelihood of the follow-through.
C Stock Options
The low-volatility fog settling into the marketplace has seeped into bank stocks like Citigroup as well. At 11%, the implied volatility rank for C remains depressed. And that means long premium plays are worth a shot. If you think the stock can climb above $65 over the coming weeks, consider buying the Jul $60/$65 bull call spread for $3.
The max risk is limited to the $3 debit and will be forfeited if the stock sits below $60 at expiration. To minimize the damage, you could exit the position if Citigroup stock breaks back below the $59 support zone.
On the reward front, you stand to capture $2 if the stock can rise above $65.
By risking $3 to make $2 this spread offers a potential 66.7% return on your money if C stock rises a mere 3% over the next month.
As of this writing, Tyler Craig owned bullish positions in XLF and C.
More From InvestorPlace
The post Citigroup Inc (C) Stock Is an Underappreciated Breakout Buy appeared first on InvestorPlace.
