A Classic Trading Pattern In QQQ
The Wall Street outlook for the tech heavy PowerShares QQQ Trust has deteriorated since it collapsed on June 9th when it dropped 2.5% on 109 million shares. This was five times the average volume. In the next three weeks the sentiment has turned even more negative as I discussed last weekend (Correction Brings Bears Out Of Woods)
The sharp decline in all the major averages last Thursday increased the bearishness of traders as the markets were nervous about the monthly jobs report. As I noted in my premarket commentary before the jobs report “There has not been any serious technical damage”.

But few technicians realized that the action in the QQQ was a classic A-B-C correction as I tweeted on July 8th. This is noted on the close only chart of the QQQ as wave A was from June 8th through June 16th. This was followed by a wave B rebound that ended on June 26th.
In a textbook example wave A will equal wave C and the sharp drop below the prior swing low acts to turn the sentiment even more negative. The equality target where wave C equals wave A was at $136.21 and the QQQ had its closing low at $136.19 on Monday July 3rd.
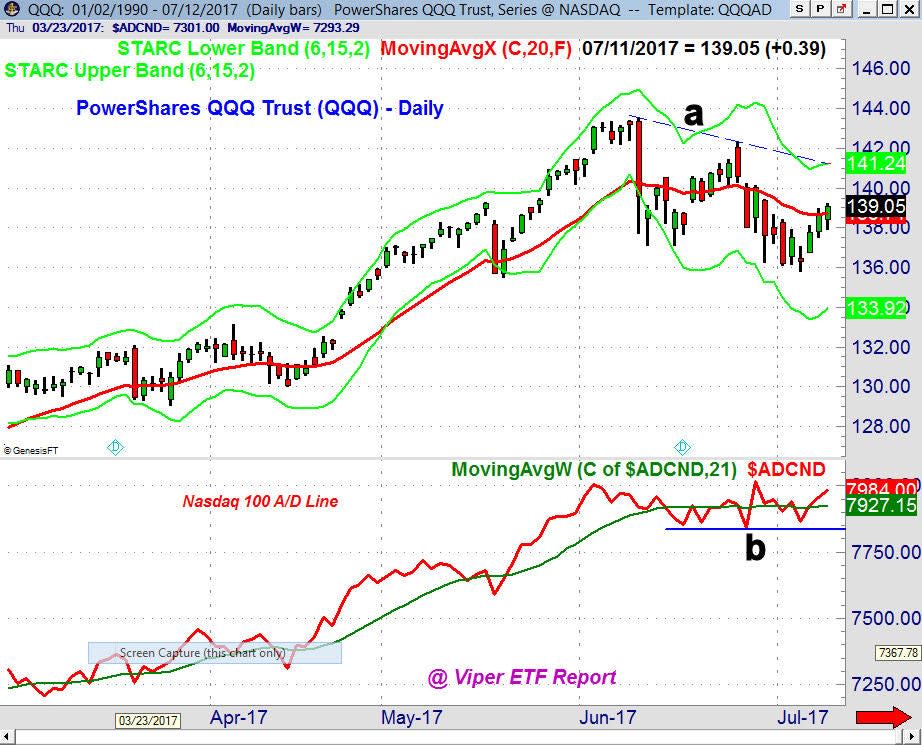
It was also positive last week that the Nasdaq 100 A/D line did not drop below key short term support (line b) last week. All of the other A/D lines that I follow also held important support. This week the A/D line has moved above its WMA and is close now to an all-time high. It was also a positive last Friday that QQQ triggered a doji buy signal and closed the week above its quarterly pivot (learn more about them here)
To confirm the correction is over the QQQ needs to now close above the downtrend which would give an initial upside Fibonacci target at $145.61. A move to new highs by the Nasdaq 100 line may lead prices higher. The higher opening on July 12 if followed by a strong close could move the A/D line to a new high.
If you are interested in specific buy and sell advice, you might consider a one-month investment of just $34.95 for either the Viper ETF or Viper Hot Stocks service. Both services include two in-depth reports per week and subscriptions can be cancelled online at any time.
If you are interested in learning more about my trading strategies, you can download a copy of my eBook and also be added to the list for the free Viper Report emails. Market commentary and technical tips are sent out several time a week. Additional market comments are often posted on the Viper Report Facebook page.
See more from Benzinga
© 2017 Benzinga.com. Benzinga does not provide investment advice. All rights reserved.
