Is Climb Global Solutions, Inc.'s (NASDAQ:CLMB) Latest Stock Performance A Reflection Of Its Financial Health?
Climb Global Solutions' (NASDAQ:CLMB) stock is up by a considerable 18% over the past three months. Given the company's impressive performance, we decided to study its financial indicators more closely as a company's financial health over the long-term usually dictates market outcomes. Particularly, we will be paying attention to Climb Global Solutions' ROE today.
Return on Equity or ROE is a test of how effectively a company is growing its value and managing investors’ money. In simpler terms, it measures the profitability of a company in relation to shareholder's equity.
View our latest analysis for Climb Global Solutions
How Is ROE Calculated?
The formula for return on equity is:
Return on Equity = Net Profit (from continuing operations) ÷ Shareholders' Equity
So, based on the above formula, the ROE for Climb Global Solutions is:
21% = US$11m ÷ US$53m (Based on the trailing twelve months to September 2022).
The 'return' is the profit over the last twelve months. That means that for every $1 worth of shareholders' equity, the company generated $0.21 in profit.
What Is The Relationship Between ROE And Earnings Growth?
We have already established that ROE serves as an efficient profit-generating gauge for a company's future earnings. Depending on how much of these profits the company reinvests or "retains", and how effectively it does so, we are then able to assess a company’s earnings growth potential. Generally speaking, other things being equal, firms with a high return on equity and profit retention, have a higher growth rate than firms that don’t share these attributes.
Climb Global Solutions' Earnings Growth And 21% ROE
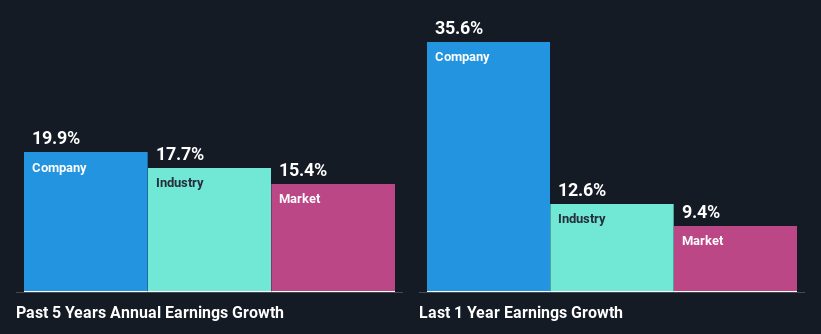
To start with, Climb Global Solutions' ROE looks acceptable. Especially when compared to the industry average of 14% the company's ROE looks pretty impressive. This probably laid the ground for Climb Global Solutions' moderate 20% net income growth seen over the past five years.
As a next step, we compared Climb Global Solutions' net income growth with the industry and found that the company has a similar growth figure when compared with the industry average growth rate of 18% in the same period.
Earnings growth is an important metric to consider when valuing a stock. The investor should try to establish if the expected growth or decline in earnings, whichever the case may be, is priced in. This then helps them determine if the stock is placed for a bright or bleak future. If you're wondering about Climb Global Solutions''s valuation, check out this gauge of its price-to-earnings ratio, as compared to its industry.
Is Climb Global Solutions Efficiently Re-investing Its Profits?
Climb Global Solutions has a three-year median payout ratio of 47%, which implies that it retains the remaining 53% of its profits. This suggests that its dividend is well covered, and given the decent growth seen by the company, it looks like management is reinvesting its earnings efficiently.
Besides, Climb Global Solutions has been paying dividends for at least ten years or more. This shows that the company is committed to sharing profits with its shareholders. Existing analyst estimates suggest that the company's future payout ratio is expected to drop to 17% over the next three years.
Conclusion
In total, we are pretty happy with Climb Global Solutions' performance. Particularly, we like that the company is reinvesting heavily into its business, and at a high rate of return. Unsurprisingly, this has led to an impressive earnings growth. Having said that, looking at the current analyst estimates, we found that the company's earnings are expected to gain momentum. To know more about the company's future earnings growth forecasts take a look at this free report on analyst forecasts for the company to find out more.
Have feedback on this article? Concerned about the content? Get in touch with us directly. Alternatively, email editorial-team (at) simplywallst.com.
This article by Simply Wall St is general in nature. We provide commentary based on historical data and analyst forecasts only using an unbiased methodology and our articles are not intended to be financial advice. It does not constitute a recommendation to buy or sell any stock, and does not take account of your objectives, or your financial situation. We aim to bring you long-term focused analysis driven by fundamental data. Note that our analysis may not factor in the latest price-sensitive company announcements or qualitative material. Simply Wall St has no position in any stocks mentioned.
Join A Paid User Research Session
You’ll receive a US$30 Amazon Gift card for 1 hour of your time while helping us build better investing tools for the individual investors like yourself. Sign up here
