A Close Look At Eternity Technology Holdings Limited’s (HKG:1725) 33% ROCE

Want to participate in a short research study? Help shape the future of investing tools and receive a $60 prize!
Today we’ll look at Eternity Technology Holdings Limited (HKG:1725) and reflect on its potential as an investment. To be precise, we’ll consider its Return On Capital Employed (ROCE), as that will inform our view of the quality of the business.
First of all, we’ll work out how to calculate ROCE. Next, we’ll compare it to others in its industry. And finally, we’ll look at how its current liabilities are impacting its ROCE.
What is Return On Capital Employed (ROCE)?
ROCE measures the amount of pre-tax profits a company can generate from the capital employed in its business. All else being equal, a better business will have a higher ROCE. Overall, it is a valuable metric that has its flaws. Author Edwin Whiting says to be careful when comparing the ROCE of different businesses, since ‘No two businesses are exactly alike.’
So, How Do We Calculate ROCE?
Analysts use this formula to calculate return on capital employed:
Return on Capital Employed = Earnings Before Interest and Tax (EBIT) ÷ (Total Assets – Current Liabilities)
Or for Eternity Technology Holdings:
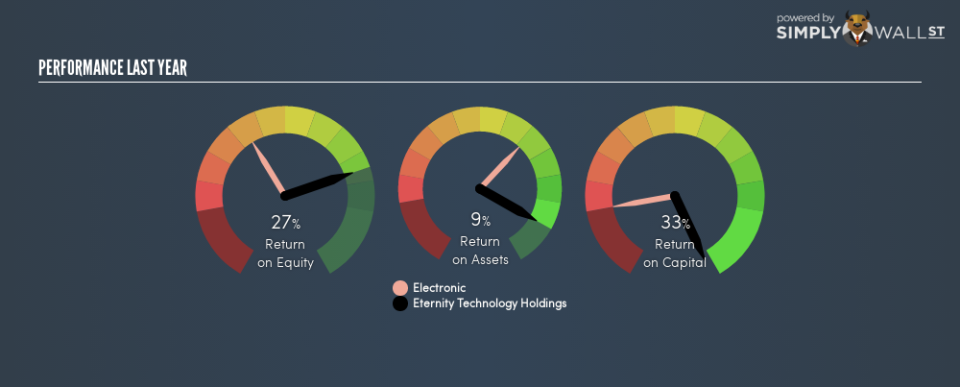
0.33 = CN¥33m ÷ (CN¥329m – CN¥225m) (Based on the trailing twelve months to June 2018.)
So, Eternity Technology Holdings has an ROCE of 33%.
Check out our latest analysis for Eternity Technology Holdings
Is Eternity Technology Holdings’s ROCE Good?
ROCE is commonly used for comparing the performance of similar businesses. Eternity Technology Holdings’s ROCE appears to be substantially greater than the 12% average in the Electronic industry. We consider this a positive sign, because it suggests it uses capital more efficiently than similar companies. Putting aside its position relative to its industry for now, in absolute terms, Eternity Technology Holdings’s ROCE is currently very good.
When considering ROCE, bear in mind that it reflects the past and does not necessarily predict the future. Companies in cyclical industries can be difficult to understand using ROCE, as returns typically look high during boom times, and low during busts. This is because ROCE only looks at one year, instead of considering returns across a whole cycle. If Eternity Technology Holdings is cyclical, it could make sense to check out this free graph of past earnings, revenue and cash flow.
Eternity Technology Holdings’s Current Liabilities And Their Impact On Its ROCE
Current liabilities are short term bills and invoices that need to be paid in 12 months or less. Due to the way the ROCE equation works, having large bills due in the near term can make it look as though a company has less capital employed, and thus a higher ROCE than usual. To check the impact of this, we calculate if a company has high current liabilities relative to its total assets.
Eternity Technology Holdings has total liabilities of CN¥225m and total assets of CN¥329m. Therefore its current liabilities are equivalent to approximately 68% of its total assets. Eternity Technology Holdings’s high level of current liabilities boost the ROCE – but its ROCE is still impressive.
Our Take On Eternity Technology Holdings’s ROCE
In my book, this business could be worthy of further research. Of course you might be able to find a better stock than Eternity Technology Holdings. So you may wish to see this free collection of other companies that have grown earnings strongly.
I will like Eternity Technology Holdings better if I see some big insider buys. While we wait, check out this free list of growing companies with considerable, recent, insider buying.
To help readers see past the short term volatility of the financial market, we aim to bring you a long-term focused research analysis purely driven by fundamental data. Note that our analysis does not factor in the latest price-sensitive company announcements.
The author is an independent contributor and at the time of publication had no position in the stocks mentioned. For errors that warrant correction please contact the editor at editorial-team@simplywallst.com.
