A Close Look At Jerash Holdings (US), Inc.’s (NASDAQ:JRSH) 16% ROCE

Today we'll look at Jerash Holdings (US), Inc. (NASDAQ:JRSH) and reflect on its potential as an investment. In particular, we'll consider its Return On Capital Employed (ROCE), as that can give us insight into how profitably the company is able to employ capital in its business.
First of all, we'll work out how to calculate ROCE. Then we'll compare its ROCE to similar companies. Then we'll determine how its current liabilities are affecting its ROCE.
What is Return On Capital Employed (ROCE)?
ROCE is a metric for evaluating how much pre-tax income (in percentage terms) a company earns on the capital invested in its business. Generally speaking a higher ROCE is better. Ultimately, it is a useful but imperfect metric. Renowned investment researcher Michael Mauboussin has suggested that a high ROCE can indicate that 'one dollar invested in the company generates value of more than one dollar'.
How Do You Calculate Return On Capital Employed?
The formula for calculating the return on capital employed is:
Return on Capital Employed = Earnings Before Interest and Tax (EBIT) ÷ (Total Assets - Current Liabilities)
Or for Jerash Holdings (US):
0.16 = US$8.8m ÷ (US$61m - US$7.3m) (Based on the trailing twelve months to June 2019.)
Therefore, Jerash Holdings (US) has an ROCE of 16%.
See our latest analysis for Jerash Holdings (US)
Is Jerash Holdings (US)'s ROCE Good?
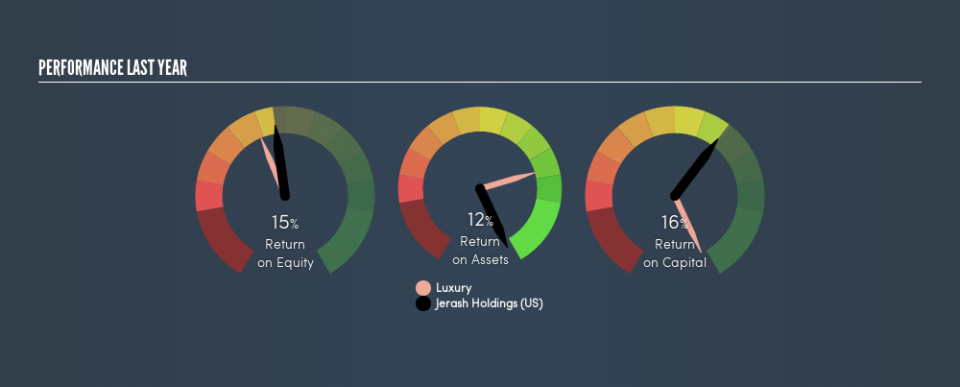
When making comparisons between similar businesses, investors may find ROCE useful. In our analysis, Jerash Holdings (US)'s ROCE is meaningfully higher than the 12% average in the Luxury industry. We consider this a positive sign, because it suggests it uses capital more efficiently than similar companies. Independently of how Jerash Holdings (US) compares to its industry, its ROCE in absolute terms appears decent, and the company may be worthy of closer investigation.
Jerash Holdings (US)'s current ROCE of 16% is lower than its ROCE in the past, which was 50%, 3 years ago. Therefore we wonder if the company is facing new headwinds. You can click on the image below to see (in greater detail) how Jerash Holdings (US)'s past growth compares to other companies.
When considering this metric, keep in mind that it is backwards looking, and not necessarily predictive. Companies in cyclical industries can be difficult to understand using ROCE, as returns typically look high during boom times, and low during busts. ROCE is only a point-in-time measure. What happens in the future is pretty important for investors, so we have prepared a free report on analyst forecasts for Jerash Holdings (US).
How Jerash Holdings (US)'s Current Liabilities Impact Its ROCE
Current liabilities are short term bills and invoices that need to be paid in 12 months or less. The ROCE equation subtracts current liabilities from capital employed, so a company with a lot of current liabilities appears to have less capital employed, and a higher ROCE than otherwise. To counteract this, we check if a company has high current liabilities, relative to its total assets.
Jerash Holdings (US) has total assets of US$61m and current liabilities of US$7.3m. Therefore its current liabilities are equivalent to approximately 12% of its total assets. A fairly low level of current liabilities is not influencing the ROCE too much.
Our Take On Jerash Holdings (US)'s ROCE
With that in mind, Jerash Holdings (US)'s ROCE appears pretty good. There might be better investments than Jerash Holdings (US) out there, but you will have to work hard to find them . These promising businesses with rapidly growing earnings might be right up your alley.
If you are like me, then you will not want to miss this free list of growing companies that insiders are buying.
We aim to bring you long-term focused research analysis driven by fundamental data. Note that our analysis may not factor in the latest price-sensitive company announcements or qualitative material.
If you spot an error that warrants correction, please contact the editor at editorial-team@simplywallst.com. This article by Simply Wall St is general in nature. It does not constitute a recommendation to buy or sell any stock, and does not take account of your objectives, or your financial situation. Simply Wall St has no position in the stocks mentioned. Thank you for reading.
