A Close Look At The Peck Company, Inc.’s (NASDAQ:PECK) 18% ROCE

Want to participate in a short research study? Help shape the future of investing tools and you could win a $250 gift card!
Today we'll evaluate The Peck Company, Inc. (NASDAQ:PECK) to determine whether it could have potential as an investment idea. In particular, we'll consider its Return On Capital Employed (ROCE), as that can give us insight into how profitably the company is able to employ capital in its business.
First of all, we'll work out how to calculate ROCE. Then we'll compare its ROCE to similar companies. Finally, we'll look at how its current liabilities affect its ROCE.
Understanding Return On Capital Employed (ROCE)
ROCE is a measure of a company's yearly pre-tax profit (its return), relative to the capital employed in the business. Generally speaking a higher ROCE is better. Ultimately, it is a useful but imperfect metric. Renowned investment researcher Michael Mauboussin has suggested that a high ROCE can indicate that 'one dollar invested in the company generates value of more than one dollar'.
So, How Do We Calculate ROCE?
Analysts use this formula to calculate return on capital employed:
Return on Capital Employed = Earnings Before Interest and Tax (EBIT) ÷ (Total Assets - Current Liabilities)
Or for Peck Company:
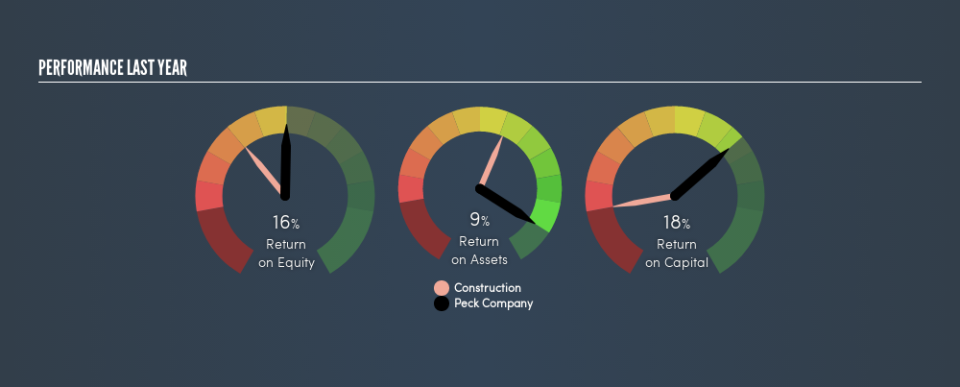
0.18 = US$1.3m ÷ (US$11m - US$3.8m) (Based on the trailing twelve months to March 2019.)
Therefore, Peck Company has an ROCE of 18%.
View our latest analysis for Peck Company
Is Peck Company's ROCE Good?
One way to assess ROCE is to compare similar companies. In our analysis, Peck Company's ROCE is meaningfully higher than the 9.5% average in the Construction industry. I think that's good to see, since it implies the company is better than other companies at making the most of its capital. Separate from Peck Company's performance relative to its industry, its ROCE in absolute terms looks satisfactory, and it may be worth researching in more depth.
Remember that this metric is backwards looking - it shows what has happened in the past, and does not accurately predict the future. ROCE can be deceptive for cyclical businesses, as returns can look incredible in boom times, and terribly low in downturns. ROCE is only a point-in-time measure. How cyclical is Peck Company? You can see for yourself by looking at this free graph of past earnings, revenue and cash flow.
Do Peck Company's Current Liabilities Skew Its ROCE?
Current liabilities are short term bills and invoices that need to be paid in 12 months or less. The ROCE equation subtracts current liabilities from capital employed, so a company with a lot of current liabilities appears to have less capital employed, and a higher ROCE than otherwise. To counter this, investors can check if a company has high current liabilities relative to total assets.
Peck Company has total liabilities of US$3.8m and total assets of US$11m. Therefore its current liabilities are equivalent to approximately 34% of its total assets. With this level of current liabilities, Peck Company's ROCE is boosted somewhat.
The Bottom Line On Peck Company's ROCE
While its ROCE looks good, it's worth remembering that the current liabilities are making the business look better. Peck Company shapes up well under this analysis, but it is far from the only business delivering excellent numbers . You might also want to check this free collection of companies delivering excellent earnings growth.
I will like Peck Company better if I see some big insider buys. While we wait, check out this free list of growing companies with considerable, recent, insider buying.
We aim to bring you long-term focused research analysis driven by fundamental data. Note that our analysis may not factor in the latest price-sensitive company announcements or qualitative material.
If you spot an error that warrants correction, please contact the editor at editorial-team@simplywallst.com. This article by Simply Wall St is general in nature. It does not constitute a recommendation to buy or sell any stock, and does not take account of your objectives, or your financial situation. Simply Wall St has no position in the stocks mentioned. Thank you for reading.
