A Close Look At Vishay Intertechnology, Inc.’s (NYSE:VSH) 18% ROCE

Want to participate in a short research study? Help shape the future of investing tools and you could win a $250 gift card!
Today we'll look at Vishay Intertechnology, Inc. (NYSE:VSH) and reflect on its potential as an investment. In particular, we'll consider its Return On Capital Employed (ROCE), as that can give us insight into how profitably the company is able to employ capital in its business.
First up, we'll look at what ROCE is and how we calculate it. Next, we'll compare it to others in its industry. Finally, we'll look at how its current liabilities affect its ROCE.
Understanding Return On Capital Employed (ROCE)
ROCE is a measure of a company's yearly pre-tax profit (its return), relative to the capital employed in the business. In general, businesses with a higher ROCE are usually better quality. In brief, it is a useful tool, but it is not without drawbacks. Renowned investment researcher Michael Mauboussin has suggested that a high ROCE can indicate that 'one dollar invested in the company generates value of more than one dollar'.
So, How Do We Calculate ROCE?
Analysts use this formula to calculate return on capital employed:
Return on Capital Employed = Earnings Before Interest and Tax (EBIT) ÷ (Total Assets - Current Liabilities)
Or for Vishay Intertechnology:
0.18 = US$474m ÷ (US$3.2b - US$574m) (Based on the trailing twelve months to March 2019.)
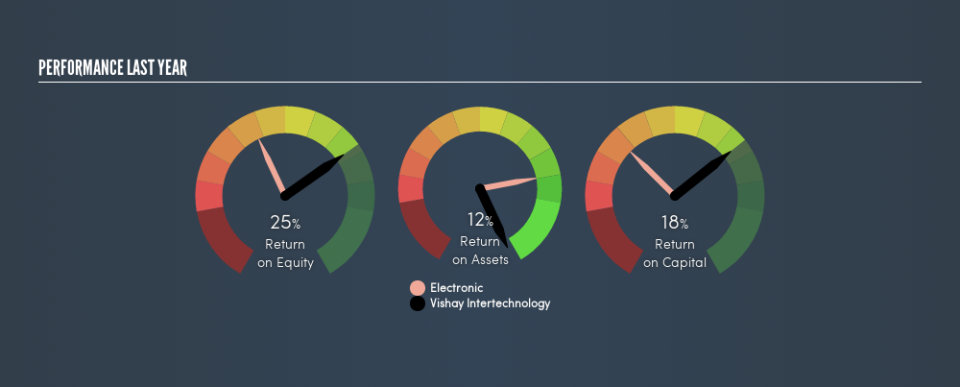
So, Vishay Intertechnology has an ROCE of 18%.
See our latest analysis for Vishay Intertechnology
Is Vishay Intertechnology's ROCE Good?
One way to assess ROCE is to compare similar companies. Using our data, we find that Vishay Intertechnology's ROCE is meaningfully better than the 12% average in the Electronic industry. I think that's good to see, since it implies the company is better than other companies at making the most of its capital. Separate from Vishay Intertechnology's performance relative to its industry, its ROCE in absolute terms looks satisfactory, and it may be worth researching in more depth.
In our analysis, Vishay Intertechnology's ROCE appears to be 18%, compared to 3 years ago, when its ROCE was 6.6%. This makes us think the business might be improving. You can click on the image below to see (in greater detail) how Vishay Intertechnology's past growth compares to other companies.
When considering this metric, keep in mind that it is backwards looking, and not necessarily predictive. Companies in cyclical industries can be difficult to understand using ROCE, as returns typically look high during boom times, and low during busts. ROCE is, after all, simply a snap shot of a single year. What happens in the future is pretty important for investors, so we have prepared a free report on analyst forecasts for Vishay Intertechnology.
Do Vishay Intertechnology's Current Liabilities Skew Its ROCE?
Short term (or current) liabilities, are things like supplier invoices, overdrafts, or tax bills that need to be paid within 12 months. Due to the way the ROCE equation works, having large bills due in the near term can make it look as though a company has less capital employed, and thus a higher ROCE than usual. To counter this, investors can check if a company has high current liabilities relative to total assets.
Vishay Intertechnology has total liabilities of US$574m and total assets of US$3.2b. Therefore its current liabilities are equivalent to approximately 18% of its total assets. A fairly low level of current liabilities is not influencing the ROCE too much.
Our Take On Vishay Intertechnology's ROCE
With that in mind, Vishay Intertechnology's ROCE appears pretty good. Vishay Intertechnology looks strong on this analysis, but there are plenty of other companies that could be a good opportunity . Here is a free list of companies growing earnings rapidly.
If you are like me, then you will not want to miss this free list of growing companies that insiders are buying.
We aim to bring you long-term focused research analysis driven by fundamental data. Note that our analysis may not factor in the latest price-sensitive company announcements or qualitative material.
If you spot an error that warrants correction, please contact the editor at editorial-team@simplywallst.com. This article by Simply Wall St is general in nature. It does not constitute a recommendation to buy or sell any stock, and does not take account of your objectives, or your financial situation. Simply Wall St has no position in the stocks mentioned. Thank you for reading.
