What Is Clover's (ASX:CLV) P/E Ratio After Its Share Price Tanked?

To the annoyance of some shareholders, Clover (ASX:CLV) shares are down a considerable 33% in the last month. Looking back further, the stock is up 5.1% in the last year.
All else being equal, a share price drop should make a stock more attractive to potential investors. In the long term, share prices tend to follow earnings per share, but in the short term prices bounce around in response to short term factors (which are not always obvious). So, on certain occasions, long term focussed investors try to take advantage of pessimistic expectations to buy shares at a better price. Perhaps the simplest way to get a read on investors' expectations of a business is to look at its Price to Earnings Ratio (PE Ratio). A high P/E ratio means that investors have a high expectation about future growth, while a low P/E ratio means they have low expectations about future growth.
Check out our latest analysis for Clover
How Does Clover's P/E Ratio Compare To Its Peers?
Clover's P/E is 30.50. The image below shows that Clover has a P/E ratio that is roughly in line with the chemicals industry average (31.1).
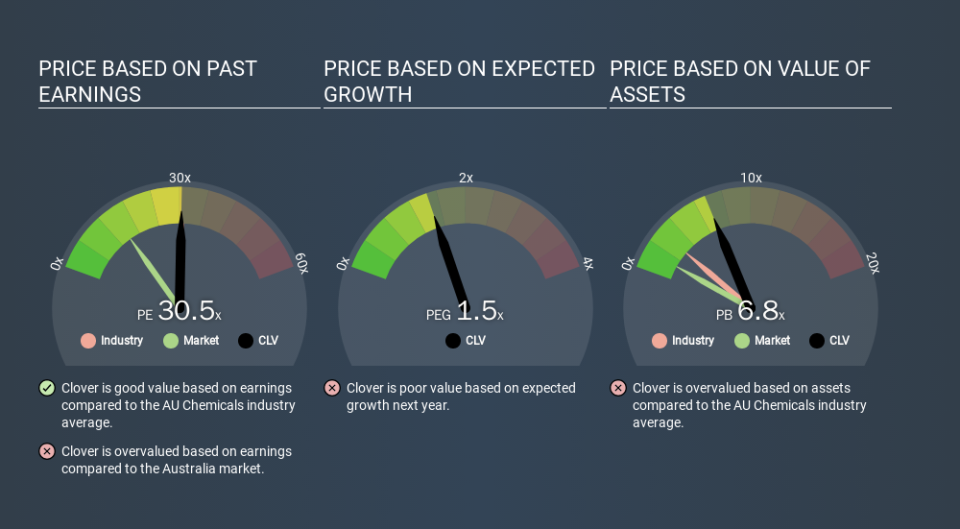
Its P/E ratio suggests that Clover shareholders think that in the future it will perform about the same as other companies in its industry classification. The company could surprise by performing better than average, in the future. I would further inform my view by checking insider buying and selling., among other things.
How Growth Rates Impact P/E Ratios
Probably the most important factor in determining what P/E a company trades on is the earnings growth. When earnings grow, the 'E' increases, over time. And in that case, the P/E ratio itself will drop rather quickly. Then, a lower P/E should attract more buyers, pushing the share price up.
It's nice to see that Clover grew EPS by a stonking 33% in the last year. And earnings per share have improved by 60% annually, over the last five years. So we'd generally expect it to have a relatively high P/E ratio.
A Limitation: P/E Ratios Ignore Debt and Cash In The Bank
The 'Price' in P/E reflects the market capitalization of the company. Thus, the metric does not reflect cash or debt held by the company. The exact same company would hypothetically deserve a higher P/E ratio if it had a strong balance sheet, than if it had a weak one with lots of debt, because a cashed up company can spend on growth.
Such expenditure might be good or bad, in the long term, but the point here is that the balance sheet is not reflected by this ratio.
How Does Clover's Debt Impact Its P/E Ratio?
Clover has net debt worth just 1.4% of its market capitalization. So it doesn't have as many options as it would with net cash, but its debt would not have much of an impact on its P/E ratio.
The Verdict On Clover's P/E Ratio
Clover has a P/E of 30.5. That's higher than the average in its market, which is 14.9. Its debt levels do not imperil its balance sheet and its EPS growth is very healthy indeed. So on this analysis a high P/E ratio seems reasonable. What can be absolutely certain is that the market has become significantly less optimistic about Clover over the last month, with the P/E ratio falling from 45.3 back then to 30.5 today. For those who don't like to trade against momentum, that could be a warning sign, but a contrarian investor might want to take a closer look.
Investors should be looking to buy stocks that the market is wrong about. As value investor Benjamin Graham famously said, 'In the short run, the market is a voting machine but in the long run, it is a weighing machine. So this free visual report on analyst forecasts could hold the key to an excellent investment decision.
Of course you might be able to find a better stock than Clover. So you may wish to see this free collection of other companies that have grown earnings strongly.
If you spot an error that warrants correction, please contact the editor at editorial-team@simplywallst.com. This article by Simply Wall St is general in nature. It does not constitute a recommendation to buy or sell any stock, and does not take account of your objectives, or your financial situation. Simply Wall St has no position in the stocks mentioned.
We aim to bring you long-term focused research analysis driven by fundamental data. Note that our analysis may not factor in the latest price-sensitive company announcements or qualitative material. Thank you for reading.
