Is Cohu, Inc.’s (NASDAQ:COHU) 10% ROE Worse Than Average?

Want to participate in a short research study? Help shape the future of investing tools and you could win a $250 gift card!
One of the best investments we can make is in our own knowledge and skill set. With that in mind, this article will work through how we can use Return On Equity (ROE) to better understand a business. By way of learning-by-doing, we’ll look at ROE to gain a better understanding of Cohu, Inc. (NASDAQ:COHU).
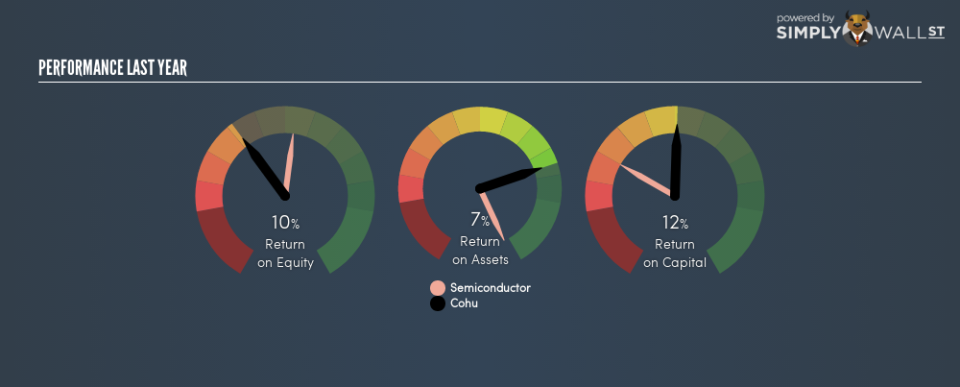
Cohu has a ROE of 10%, based on the last twelve months. That means that for every $1 worth of shareholders’ equity, it generated $0.10 in profit.
View our latest analysis for Cohu
How Do I Calculate Return On Equity?
The formula for ROE is:
Return on Equity = Net Profit ÷ Shareholders’ Equity
Or for Cohu:
10% = 31.468 ÷ US$309m (Based on the trailing twelve months to September 2018.)
Most readers would understand what net profit is, but it’s worth explaining the concept of shareholders’ equity. It is all earnings retained by the company, plus any capital paid in by shareholders. You can calculate shareholders’ equity by subtracting the company’s total liabilities from its total assets.
What Does Return On Equity Signify?
ROE measures a company’s profitability against the profit it retains, and any outside investments. The ‘return’ is the profit over the last twelve months. That means that the higher the ROE, the more profitable the company is. So, all else being equal, a high ROE is better than a low one. Clearly, then, one can use ROE to compare different companies.
Does Cohu Have A Good Return On Equity?
By comparing a company’s ROE with its industry average, we can get a quick measure of how good it is. However, this method is only useful as a rough check, because companies do differ quite a bit within the same industry classification. If you look at the image below, you can see Cohu has a lower ROE than the average (17%) in the Semiconductor industry classification.
That certainly isn’t ideal. We’d prefer see an ROE above the industry average, but it might not matter if the company is undervalued. Nonetheless, it could be useful to double-check if insiders have sold shares recently.
Why You Should Consider Debt When Looking At ROE
Virtually all companies need money to invest in the business, to grow profits. That cash can come from issuing shares, retained earnings, or debt. In the first and second cases, the ROE will reflect this use of cash for investment in the business. In the latter case, the debt required for growth will boost returns, but will not impact the shareholders’ equity. In this manner the use of debt will boost ROE, even though the core economics of the business stay the same.
Combining Cohu’s Debt And Its 10% Return On Equity
Although Cohu does use a little debt, its debt to equity ratio of just 0.026 is very low. Its ROE isn’t particularly impressive, but the debt levels are quite modest, so the business probably has some real potential. Conservative use of debt to boost returns is usually a good move for shareholders, though it does leave the company more exposed to interest rate rises.
The Key Takeaway
Return on equity is one way we can compare the business quality of different companies. Companies that can achieve high returns on equity without too much debt are generally of good quality. If two companies have the same ROE, then I would generally prefer the one with less debt.
But ROE is just one piece of a bigger puzzle, since high quality businesses often trade on high multiples of earnings. It is important to consider other factors, such as future profit growth — and how much investment is required going forward. So you might want to take a peek at this data-rich interactive graph of forecasts for the company.
If you would prefer check out another company — one with potentially superior financials — then do not miss this free list of interesting companies, that have HIGH return on equity and low debt.
To help readers see past the short term volatility of the financial market, we aim to bring you a long-term focused research analysis purely driven by fundamental data. Note that our analysis does not factor in the latest price-sensitive company announcements.
The author is an independent contributor and at the time of publication had no position in the stocks mentioned. For errors that warrant correction please contact the editor at editorial-team@simplywallst.com.
