Comp SA (WSE:CMP): Did It Outperform The Industry?

When Comp SA (WSE:CMP) announced its most recent earnings (31 March 2018), I did two things: looked at its past earnings track record, then look at what is happening in the industry. Understanding how Comp performed requires a benchmark rather than trying to assess a standalone number at one point in time. Below is a quick commentary on how I see CMP has performed.
View our latest analysis for Comp
Was CMP’s recent earnings decline indicative of a tough track record?
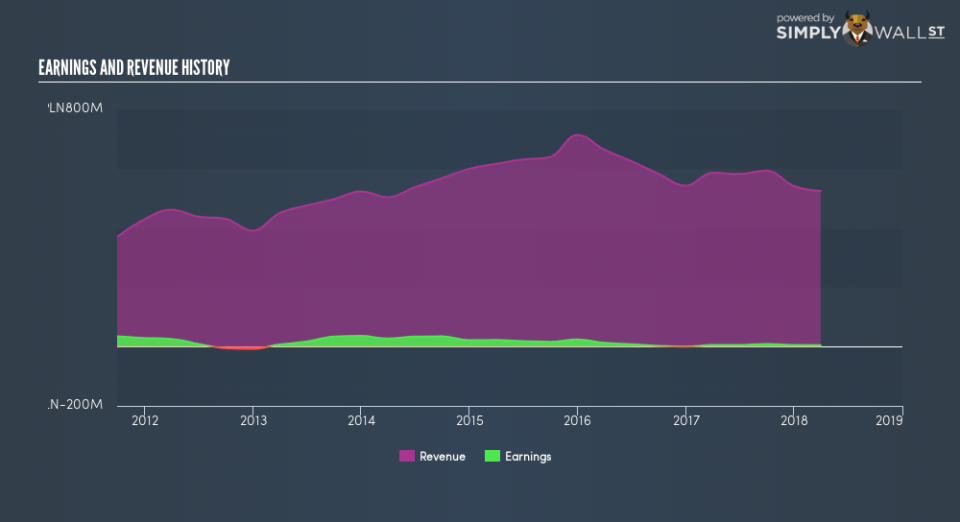
CMP’s trailing twelve-month earnings (from 31 March 2018) of zł4.7m has declined by -7.0% compared to the previous year. Furthermore, this one-year growth rate has been lower than its average earnings growth rate over the past 5 years of -15.1%, indicating the rate at which CMP is growing has slowed down. Why could this be happening? Let’s examine what’s occurring with margins and if the entire industry is experiencing the hit as well.
Revenue growth over the last few years, has been positive, yet earnings growth has been falling. This implies that Comp has been growing expenses, which is harming margins and earnings, and is not a sustainable practice. Scanning growth from a sector-level, the PL it industry has been growing, albeit, at a muted single-digit rate of 3.5% over the previous year, and a flatter 0.4% over the past five years. This growth is a median of profitable companies of 15 IT companies in PL including KBJ, Indata and Grupa Exorigo-Upos. This suggests that any recent headwind the industry is enduring, it’s hitting Comp harder than its peers.
In terms of returns from investment, Comp has fallen short of achieving a 20% return on equity (ROE), recording 1.2% instead. Furthermore, its return on assets (ROA) of 1.6% is below the PL IT industry of 5.7%, indicating Comp’s are utilized less efficiently. And finally, its return on capital (ROC), which also accounts for Comp’s debt level, has declined over the past 3 years from 7.5% to 2.2%. This correlates with an increase in debt holding, with debt-to-equity ratio rising from 20.0% to 49.5% over the past 5 years.
What does this mean?
While past data is useful, it doesn’t tell the whole story. Typically companies that experience a drawn out period of diminishing earnings are going through some sort of reinvestment phase Although, if the whole industry is struggling to grow over time, it may be a sign of a structural change, which makes Comp and its peers a riskier investment. I suggest you continue to research Comp to get a better picture of the stock by looking at:
Future Outlook: What are well-informed industry analysts predicting for CMP’s future growth? Take a look at our free research report of analyst consensus for CMP’s outlook.
Financial Health: Are CMP’s operations financially sustainable? Balance sheets can be hard to analyze, which is why we’ve done it for you. Check out our financial health checks here.
Other High-Performing Stocks: Are there other stocks that provide better prospects with proven track records? Explore our free list of these great stocks here.
NB: Figures in this article are calculated using data from the trailing twelve months from 31 March 2018. This may not be consistent with full year annual report figures.
To help readers see past the short term volatility of the financial market, we aim to bring you a long-term focused research analysis purely driven by fundamental data. Note that our analysis does not factor in the latest price-sensitive company announcements.
The author is an independent contributor and at the time of publication had no position in the stocks mentioned. For errors that warrant correction please contact the editor at editorial-team@simplywallst.com.
