Comparing Bitcoin (BTC) and Ethereum (ETH) Price Movement Cycles
In this article, BeInCrypto takes a look at previous bitcoin (BTC) and Ethereum (ETH) price movement cycles. The purpose is to try and determine if there is a significant difference in volatility between the two.
While the 2017-2020 movements have been relatively similar, ETH has increased at a much faster rate in 2021.
2017-2020 cycles
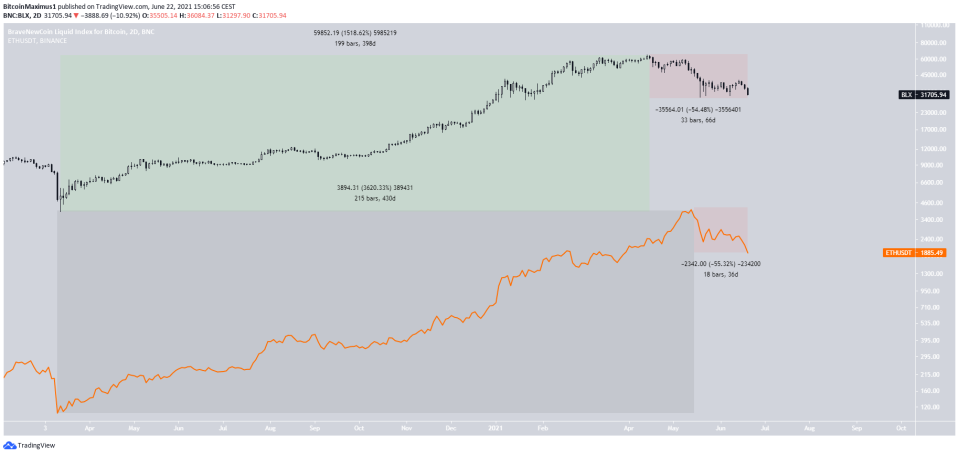
The BTC price is shown in candlesticks while the ETH chart is shown with the orange line.
Between 2017 and 2020, the movement has been relatively similar for both assets.
Measuring from the all-time high of early 2018, BTC corrected for a 363 day period, losing 84% of its value in the process. On the other hand, ETH corrected for 336 days, losing 94% of its value. Therefore, while the ETH correction was sharper and lasted for a shorter period of time, there was not a pronounced difference between the two.
Following this, BTC increased by 330% in 191 days, while ETH moved upwards by 290% in 197 days. This somewhat made up for the difference from the sharper ETH fall preceding this upward movement.
Finally, BTC decreased by 71.50% in 261 days leading up to the March 2020 bottom, while ETH decreased by 66.50% in 259 days, with very similar rates of decrease.

Current BTC and ETH movements
Unlike the 2017-2020 period, there is a significant difference in the movement of both assets in 2021.
Measuring from the March 2020 bottom, BTC increased by 1,520% in 398 days. While this is a formidable rate of increase, ETH more than doubled it by increasing 3,620% in 430 days.
In addition to this, the corrections have had the same rate of decrease, though the ETH correction has been nearly twice as fast.
For BeInCrypto’s latest bitcoin (BTC) analysis, click here.
