Comparing PayPal (NASDAQ:PYPL) to Competitors Reveals Pockets of Opportunity in FinTech Companies
This article was originally published on Simply Wall St News
PayPal Holdings, Inc. (NASDAQ:PYPL) shareholders might be concerned after seeing the share price drop 10% in the last quarter. But that doesn't undermine the fantastic longer term performance (measured over five years). Indeed, the share price is up a whopping 540% in that time. Not only that, on an annual basis, PayPal has over-performed on a risk adjusted basis by 22.4% (Jensen's Alpha). Today, we are going to take a step further and look at how PayPal performs in relation to competitors.
View our latest analysis for PayPal Holdings
Fundamental Outline
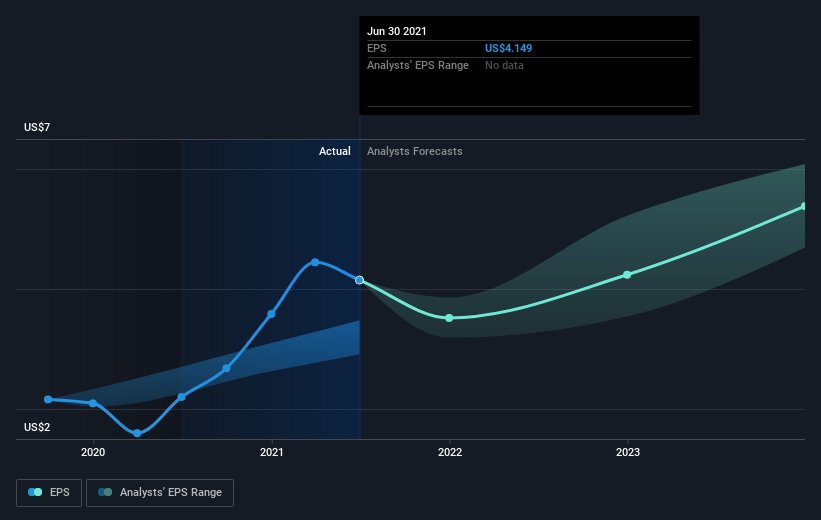
Over half a decade, PayPal Holdings managed to grow its earnings per share at 30% a year. This EPS growth is lower than the 45% average annual increase in the share price. This suggests that market participants hold the company in higher regard.
That's not necessarily surprising considering the five-year track record of earnings growth. This favorable sentiment is reflected in its (fairly optimistic) P/E ratio of 62.5x.
You can see below how EPS has changed over time (discover the exact values by clicking on the image).
It is of course excellent to see how PayPal Holdings has grown profits over the years, but the future is more important for shareholders. This free interactive report on PayPal Holdings' balance sheet strength is a great place to start, if you want to investigate the stock further.
Competitor Analysis
As we go beyond the stock, we need to define the major competitors, and then compare them on a fundamental basis. This will give us a hint of the quality of performance.
For our analysis, the first step is to define the competitors. This is almost always a subjective choice, and different services will pick different competitors. We will pick both large competitors and young growth companies that seek a portion of the market share.
The competitors we are going to compare are:
Visa (NASDAQ:V) - Payment technology and processing
Mastercard (NYSE:MA) - Transaction and payment processing
Square (NYSE:SQ) - Merchant payment processing, financial services
Fidelity National Information Services (NYSE:FIS) - Merchant solutions, integrated payment, e-commerce
Fiserv (NASDAQ:FISV) - Payment and financial services
SoFi Technologies (NASDAQ:SOFI) - Financial services, accent on loans
Paysafe (NYSE:PSFE) - Payment processing, financial services
In the selection process, we must note that the companies do not have exactly the same business model, but are highly related to the financial industry at a consumer and merchant level. They also have a substantial portion of their revenues come from some form of payment processing, financial service and banking alternatives.
First, we will sum the trailing twelve-month revenues (ending in the most recent quarter) from the listed companies, and compute a total revenue value for companies that are engaged in this industry. This would be closely akin to a total market share, and for our selections it amounts to a revenue value of US$109b.
In the picture below, we will see the distribution of market share from the listed peers:
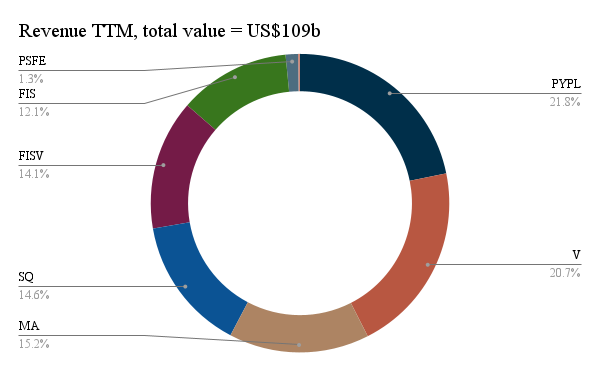
From the chart above, we see that both PayPal and Visa are the two market leaders in the financial transaction services, with around 20% market share. Keep in mind that the competitors are generally, but not precisely comparable, and that the analysis does not account for privately held companies in the same field such as Stripe.
Next, we move on to growth, and compare how much the revenues have changed from the same trailing twelve-month period 1 year ago.
This gives us a great picture as to which company grew the most.
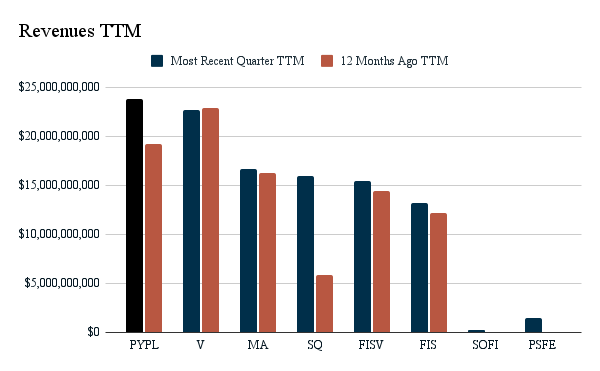
We see that the two highest growing companies in this space are both PayPal and Square. In fact, Square grew revenues by an amazing 170%, and PayPal grew revenues by a substantial 24%. It seems that PayPal is efficiently capturing new growth in the sector, while Square is rapidly reaching a leadership position.
Our final step will be to see how profitable are these companies, in order to analyze how good they are into converting revenues to the precursor for cash flows to shareholders. For this purpose we will use EBIT margins, because they account for the business expenses that a company has, and make profits more comparable before taxes and extraordinary items.
In the last chart, we will compare profitability margins of competitors:
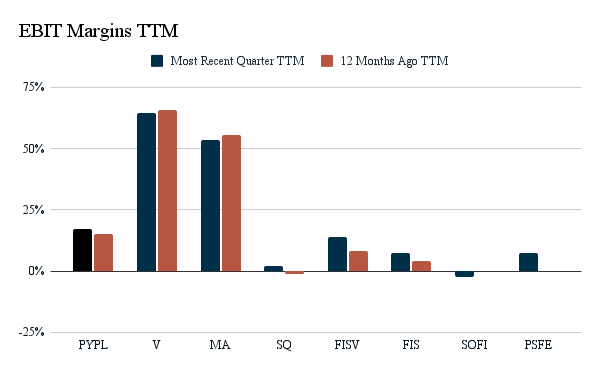
The margins give interesting insight. They show that PayPal has both healthy and growing margins. Square turned profitable EBIT margins, but still is in the beginning phase of its profitability and will take some time to stabilize. FISV, seems to be an interesting candidate to explore further, as it also managed to grow the margin substantially.
On the other hand, the last 12 months have not been kind to Mastercard and Visa, since both companies seem to be experiencing a slight decline in profitability. Their high margins also make them a golden target for new FinTech startups like SoFi and PaySafe, which might bring cost-cutting innovation to the table that takes away some market share from the big players.
In the end, those who provide a better product for consumers end up winning in the long term. The FinTech industry does have some high barriers to entry in regard to technology infrastructure and legal compliance, but those too are subsiding as cloud services are making development more available to smaller competitors.
Looking at the comparisons, we would take a deeper dive into PayPal and see their stock price value, at the same time we would examine FISV as a potential candidate, and put SOFI and PSFE in a high-risk watchlist.
Key Takeaways
The competitor analysis shows that PayPal, Square and Fiserv have great fundamental potential.
The analysis covered the revenues and profitability. We did not go over the pricing of the stocks or their balance sheet. Investors that want to take a deeper look can explore these companies individually on our platform.
If you visit the companies on SimplyWallSt, you will find that our valuation model reveals Paypal to be trading around fair value, Square to be overvalued and Fiserv to be undervalued, but investors should make a deeper dive in every individual company before making a decision.
As our analysis had a focus on PayPal, it revealed that the company has healthy growth, margins and that analysts estimate a stabilization of EPS by 2023, and then, a resurgence of earnings growth. Looking backwards, PayPal is an over-performer in relation to its risk profile, and has given investors a 45% average annual increase of the share price.
The FinTech industry has re-discovered growth and is currently in the process of transformation. This may cut-costs for services and take some profitability of established, large companies like Visa and Mastercard.
Please note, the market returns quoted in this article reflect the market weighted average returns of stocks that currently trade on US exchanges.
Simply Wall St analyst Goran Damchevski and Simply Wall St have no position in any of the companies mentioned. This article is general in nature. We provide commentary based on historical data and analyst forecasts only using an unbiased methodology and our articles are not intended to be financial advice. It does not constitute a recommendation to buy or sell any stock and does not take account of your objectives, or your financial situation. We aim to bring you long-term focused analysis driven by fundamental data. Note that our analysis may not factor in the latest price-sensitive company announcements or qualitative material.
Have feedback on this article? Concerned about the content? Get in touch with us directly. Alternatively, email editorial-team@simplywallst.com
