How Do CompX International Inc.’s (NYSEMKT:CIX) Returns On Capital Compare To Peers?

Today we’ll evaluate CompX International Inc. (NYSEMKT:CIX) to determine whether it could have potential as an investment idea. Specifically, we’ll consider its Return On Capital Employed (ROCE), since that will give us an insight into how efficiently the business can generate profits from the capital it requires.
First of all, we’ll work out how to calculate ROCE. Then we’ll compare its ROCE to similar companies. And finally, we’ll look at how its current liabilities are impacting its ROCE.
Return On Capital Employed (ROCE): What is it?
ROCE is a metric for evaluating how much pre-tax income (in percentage terms) a company earns on the capital invested in its business. All else being equal, a better business will have a higher ROCE. Overall, it is a valuable metric that has its flaws. Author Edwin Whiting says to be careful when comparing the ROCE of different businesses, since ‘No two businesses are exactly alike.’
How Do You Calculate Return On Capital Employed?
Analysts use this formula to calculate return on capital employed:
Return on Capital Employed = Earnings Before Interest and Tax (EBIT) ÷ (Total Assets – Current Liabilities)
Or for CompX International:
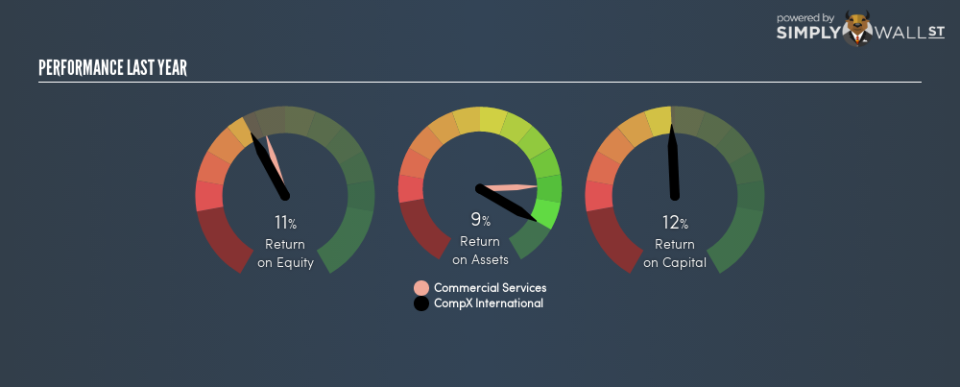
0.12 = US$15m ÷ (US$164m – US$13m) (Based on the trailing twelve months to September 2018.)
So, CompX International has an ROCE of 12%.
Check out our latest analysis for CompX International
Want to help shape the future of investing tools and platforms? Take the survey and be part of one of the most advanced studies of stock market investors to date.
Is CompX International’s ROCE Good?
ROCE is commonly used for comparing the performance of similar businesses. We can see CompX International’s ROCE is around the 11% average reported by the Commercial Services industry. Regardless of where CompX International sits next to its industry, its ROCE in absolute terms appears satisfactory, and this company could be worth a closer look.
When considering ROCE, bear in mind that it reflects the past and does not necessarily predict the future. Companies in cyclical industries can be difficult to understand using ROCE, as returns typically look high during boom times, and low during busts. ROCE is only a point-in-time measure. You can check if CompX International has cyclical profits by looking at this free graph of past earnings, revenue and cash flow.
Do CompX International’s Current Liabilities Skew Its ROCE?
Short term (or current) liabilities, are things like supplier invoices, overdrafts, or tax bills that need to be paid within 12 months. Due to the way the ROCE equation works, having large bills due in the near term can make it look as though a company has less capital employed, and thus a higher ROCE than usual. To counter this, investors can check if a company has high current liabilities relative to total assets.
CompX International has total assets of US$164m and current liabilities of US$13m. As a result, its current liabilities are equal to approximately 8.1% of its total assets. Low current liabilities have only a minimal impact on CompX International’s ROCE, making its decent returns more credible.
Our Take On CompX International’s ROCE
If CompX International can continue reinvesting in its business, it could be an attractive prospect. But note: CompX International may not be the best stock to buy. So take a peek at this free list of interesting companies with strong recent earnings growth (and a P/E ratio below 20).
I will like CompX International better if I see some big insider buys. While we wait, check out this free list of growing companies with considerable, recent, insider buying.
To help readers see past the short term volatility of the financial market, we aim to bring you a long-term focused research analysis purely driven by fundamental data. Note that our analysis does not factor in the latest price-sensitive company announcements.
The author is an independent contributor and at the time of publication had no position in the stocks mentioned. For errors that warrant correction please contact the editor at editorial-team@simplywallst.com.
