Should You Be Concerned About China Zheshang Bank Co Ltd’s (HKG:2016) Liquidity?

As a large-cap stock with market capitalization of HK$86.57B, China Zheshang Bank Co Ltd (SEHK:2016) falls into the category of a major bank. As these large financial institutions revert back to health after the 2008 Financial Crisis, we are seeing an increase in market confidence in these “too-big-to-fail” banking stocks. Following the crisis, a set of reforms termed Basel III was enforced to bolster risk management, regulation, and supervision in the financial services industry. These reforms target banking regulations and intends to enhance financial institutions’ ability to absorb shocks resulting from economic stress which could expose banks to vulnerabilities. Operating in HK, 2016 is held to strict regulation which focus investor attention to the type and level of risk it takes on. Investors should be more cautious when it comes to financial stocks given the different type of risk to which they are exposed. Today we will analyse some bank-specific metrics and take a closer look at leverage and liquidity. View our latest analysis for China Zheshang Bank
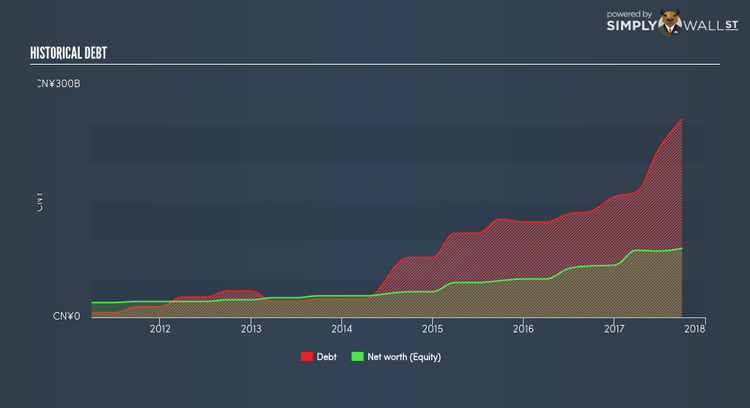
Is 2016’s Leverage Level Appropriate?
Banks with low leverage are better positioned to weather adverse headwinds as they have less debt to pay off. A bank’s leverage may be thought of as the level of assets it owns compared to its own shareholders’ equity. While financial companies will always have some leverage for a sufficient capital buffer, China Zheshang Bank’s leverage ratio of 17x is significantly below the appropriate ceiling of 20x. With assets 17 times equity, the banks has maintained a prudent level of its own fund relative to borrowed fund which places it in a strong position to pay back its debt in times of adverse events. If the bank needs to increase its debt levels to firm up its capital cushion, there is plenty of headroom to do so without deteriorating its financial position.
What Is 2016’s Level of Liquidity?

Due to its illiquid nature, loans are an important asset class we should learn more about. Normally, they should not exceed 70% of total assets, consistent with China Zheshang Bank’s case with a much lower ratio of 36.20%. This means less than half of the bank’s total assets are tied up in the form of illiquid loans, leading to high liquidity, perhaps at the expense of generating interest income.
What is 2016’s Liquidity Discrepancy?
2016 profits by lending out its customers’ deposits as loans and charge an interest on the principle. Loans are generally fixed term which means they cannot be readily realized, conversely, on the liability side, customer deposits must be paid in very short notice and on-demand. The discrepancy between loan assets and deposit liabilities threatens the bank’s financial position. If an adverse event occurs, it may not be well-placed to repay its depositors immediately. Compared to the appropriate industry loan to deposit level of 90%, China Zheshang Bank’s ratio of over 48.56%is noticeably lower, which means the bank is lending out less than its total level of deposits and positions the bank cautiously in terms of liquidity as it has not disproportionately lent out its deposits and has retained an apt level of deposits. Given the large headroom for growth in loans, the bank has opportunity to grow its interest income.
Next Steps:
China Zheshang Bank passes all of our liquidity and leverage checks which shows it is prudent in managing those factors. This gives us confidence in the operational side of the business, an important aspect to consider before investing in the stock. High liquidity and low leverage places the bank in an ideal position to repay financial liabilities in case of adverse headwinds. We’ve only touched on operational risks for 2016 in this article. But as a stock investment, there are other fundamentals you need to understand. There are three essential factors you should look at:
Future Outlook: What are well-informed industry analysts predicting for 2016’s future growth? Take a look at our free research report of analyst consensus for 2016’s outlook.
Valuation: What is 2016 worth today? Has the future growth potential already been factored into the price? The intrinsic value infographic in our free research report helps visualize whether 2016 is currently mispriced by the market.
Other High-Performing Stocks: Are there other stocks that provide better prospects with proven track records? Explore our free list of these great stocks here.
To help readers see pass the short term volatility of the financial market, we aim to bring you a long-term focused research analysis purely driven by fundamental data. Note that our analysis does not factor in the latest price sensitive company announcements.
The author is an independent contributor and at the time of publication had no position in the stocks mentioned.
