Should You Be Concerned About F-Secure Oyj's (HEL:FSC1V) ROE?

Want to participate in a short research study? Help shape the future of investing tools and you could win a $250 gift card!
While some investors are already well versed in financial metrics (hat tip), this article is for those who would like to learn about Return On Equity (ROE) and why it is important. To keep the lesson grounded in practicality, we'll use ROE to better understand F-Secure Oyj (HEL:FSC1V).
F-Secure Oyj has a ROE of 1.3%, based on the last twelve months. Another way to think of that is that for every €1 worth of equity in the company, it was able to earn €0.013.
View our latest analysis for F-Secure Oyj
How Do I Calculate Return On Equity?
The formula for return on equity is:
Return on Equity = Net Profit ÷ Shareholders' Equity
Or for F-Secure Oyj:
1.3% = €844k ÷ €66m (Based on the trailing twelve months to December 2018.)
Most readers would understand what net profit is, but it’s worth explaining the concept of shareholders’ equity. It is all the money paid into the company from shareholders, plus any earnings retained. You can calculate shareholders' equity by subtracting the company's total liabilities from its total assets.
What Does Return On Equity Mean?
ROE measures a company's profitability against the profit it retains, and any outside investments. The 'return' is the yearly profit. That means that the higher the ROE, the more profitable the company is. So, as a general rule, a high ROE is a good thing. That means it can be interesting to compare the ROE of different companies.
Does F-Secure Oyj Have A Good ROE?
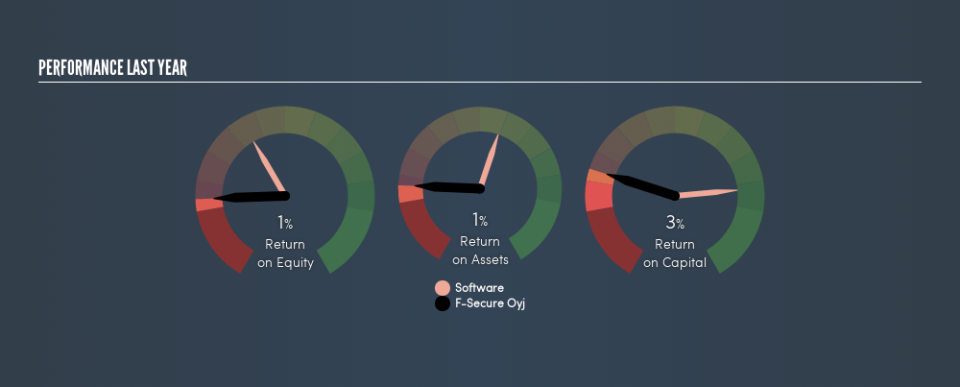
Arguably the easiest way to assess company's ROE is to compare it with the average in its industry. Importantly, this is far from a perfect measure, because companies differ significantly within the same industry classification. If you look at the image below, you can see F-Secure Oyj has a lower ROE than the average (11%) in the Software industry classification.
That's not what we like to see. We'd prefer see an ROE above the industry average, but it might not matter if the company is undervalued. Nonetheless, it might be wise to check if insiders have been selling.
Why You Should Consider Debt When Looking At ROE
Virtually all companies need money to invest in the business, to grow profits. That cash can come from retained earnings, issuing new shares (equity), or debt. In the first and second cases, the ROE will reflect this use of cash for investment in the business. In the latter case, the debt required for growth will boost returns, but will not impact the shareholders' equity. In this manner the use of debt will boost ROE, even though the core economics of the business stay the same.
F-Secure Oyj's Debt And Its 1.3% ROE
Although F-Secure Oyj does use debt, its debt to equity ratio of 0.56 is still low. Its ROE is certainly on the low side, and since it already uses debt, we're not too excited about the company. Careful use of debt to boost returns is often very good for shareholders. However, it could reduce the company's ability to take advantage of future opportunities.
The Bottom Line On ROE
Return on equity is useful for comparing the quality of different businesses. Companies that can achieve high returns on equity without too much debt are generally of good quality. All else being equal, a higher ROE is better.
But ROE is just one piece of a bigger puzzle, since high quality businesses often trade on high multiples of earnings. The rate at which profits are likely to grow, relative to the expectations of profit growth reflected in the current price, must be considered, too. So you might want to take a peek at this data-rich interactive graph of forecasts for the company.
If you would prefer check out another company -- one with potentially superior financials -- then do not miss this free list of interesting companies, that have HIGH return on equity and low debt.
We aim to bring you long-term focused research analysis driven by fundamental data. Note that our analysis may not factor in the latest price-sensitive company announcements or qualitative material.
If you spot an error that warrants correction, please contact the editor at editorial-team@simplywallst.com. This article by Simply Wall St is general in nature. It does not constitute a recommendation to buy or sell any stock, and does not take account of your objectives, or your financial situation. Simply Wall St has no position in the stocks mentioned. Thank you for reading.
