Should You Be Concerned About Hays plc’s (LON:HAS) Earnings Growth?

Assessing Hays plc’s (LON:HAS) past track record of performance is an insightful exercise for investors. It allows us to reflect on whether or not the company has met or exceed expectations, which is a great indicator for future performance. Today I will assess HAS’s recent performance announced on 31 December 2017 and evaluate these figures to its long-term trend and industry movements.
See our latest analysis for Hays
How Well Did HAS Perform?
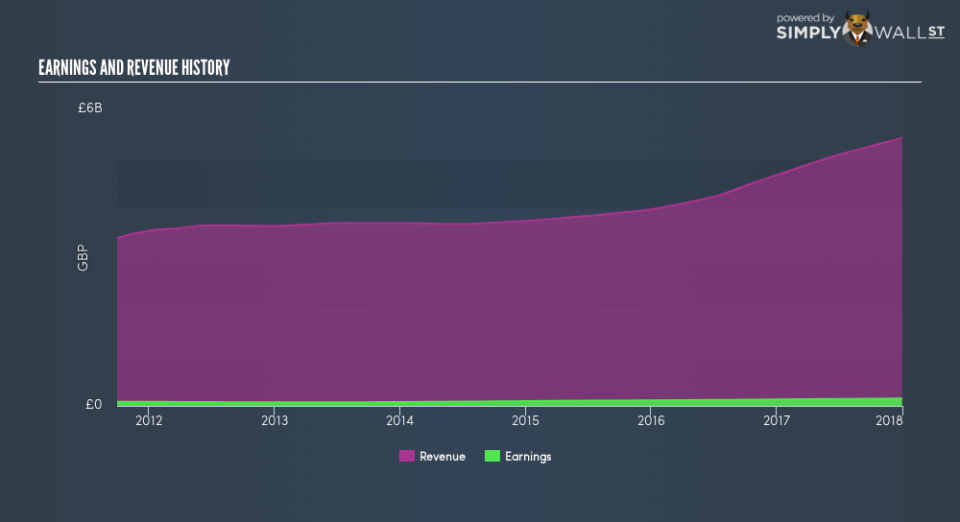
HAS’s trailing twelve-month earnings (from 31 December 2017) of UK£151.7m has jumped 17.1% compared to the previous year. Furthermore, this one-year growth rate has exceeded its 5-year annual growth average of 12.5%, indicating the rate at which HAS is growing has accelerated. How has it been able to do this? Well, let’s take a look at whether it is solely owing to industry tailwinds, or if Hays has seen some company-specific growth.
Over the past couple of years, Hays increased its bottom line faster than revenue by successfully controlling its costs. This brought about a margin expansion and profitability over time. Viewing growth from a sector-level, the UK professional services industry has been growing its average earnings by double-digit 15.6% over the prior year, and 12.5% over the past five. This growth is a median of profitable companies of 24 Professional Services companies in GB including Gordon Dadds Group, Oleeo and Harvey Nash Group. This means that whatever tailwind the industry is benefiting from, Hays is capable of leveraging this to its advantage.
In terms of returns from investment, Hays has invested its equity funds well leading to a 26.0% return on equity (ROE), above the sensible minimum of 20%. Furthermore, its return on assets (ROA) of 11.5% exceeds the GB Professional Services industry of 8.2%, indicating Hays has used its assets more efficiently. And finally, its return on capital (ROC), which also accounts for Hays’s debt level, has increased over the past 3 years from 31.4% to 33.2%. This correlates with a decrease in debt holding, with debt-to-equity ratio declining from 98.2% to 13.7% over the past 5 years.
What does this mean?
While past data is useful, it doesn’t tell the whole story. Positive growth and profitability are what investors like to see in a company’s track record, but how do we properly assess sustainability? I suggest you continue to research Hays to get a better picture of the stock by looking at:
Future Outlook: What are well-informed industry analysts predicting for HAS’s future growth? Take a look at our free research report of analyst consensus for HAS’s outlook.
Financial Health: Are HAS’s operations financially sustainable? Balance sheets can be hard to analyze, which is why we’ve done it for you. Check out our financial health checks here.
Other High-Performing Stocks: Are there other stocks that provide better prospects with proven track records? Explore our free list of these great stocks here.
NB: Figures in this article are calculated using data from the trailing twelve months from 31 December 2017. This may not be consistent with full year annual report figures.
To help readers see past the short term volatility of the financial market, we aim to bring you a long-term focused research analysis purely driven by fundamental data. Note that our analysis does not factor in the latest price-sensitive company announcements.
The author is an independent contributor and at the time of publication had no position in the stocks mentioned. For errors that warrant correction please contact the editor at editorial-team@simplywallst.com.
