Should You Be Concerned About Jungheinrich Aktiengesellschaft’s (FRA:JUN3) Earnings Growth?

Examining how Jungheinrich Aktiengesellschaft (FRA:JUN3) is performing as a company requires looking at more than just a years’ earnings. Below, I will run you through a simple sense check to build perspective on how Jungheinrich is doing by comparing its most recent earnings with its historical trend, in addition to the performance of its machinery industry peers.
View our latest analysis for Jungheinrich
Were JUN3’s earnings stronger than its past performances and the industry?
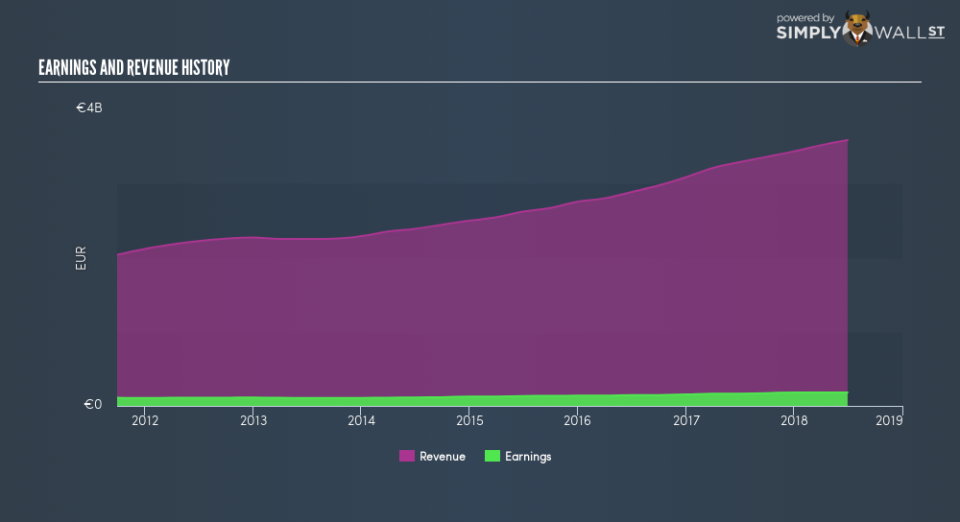
JUN3’s trailing twelve-month earnings (from 30 June 2018) of €180.6m has increased by 8.9% compared to the previous year. However, this one-year growth rate has been lower than its average earnings growth rate over the past 5 years of 9.0%, indicating the rate at which JUN3 is growing has slowed down. To understand what’s happening, let’s look at what’s going on with margins and if the entire industry is facing the same headwind.
In the last couple of years, revenue growth has failed to keep up which indicates that Jungheinrich’s bottom line has been propelled by unsustainable cost-reductions. Eyeballing growth from a sector-level, the DE machinery industry has been growing its average earnings by double-digit 14.4% over the prior twelve months, and a less exciting 9.0% over the past five. This growth is a median of profitable companies of 24 Machinery companies in DE including KHD Humboldt Wedag Vermögensverwaltungs-AG, KSB SE KGaA and Heidelberger Druckmaschinen. This suggests that any uplift the industry is deriving benefit from, Jungheinrich has not been able to reap as much as its industry peers.
In terms of returns from investment, Jungheinrich has fallen short of achieving a 20% return on equity (ROE), recording 14.1% instead. Furthermore, its return on assets (ROA) of 4.4% is below the DE Machinery industry of 5.8%, indicating Jungheinrich’s are utilized less efficiently. And finally, its return on capital (ROC), which also accounts for Jungheinrich’s debt level, has declined over the past 3 years from 8.5% to 8.1%.
What does this mean?
Though Jungheinrich’s past data is helpful, it is only one aspect of my investment thesis. Positive growth and profitability are what investors like to see in a company’s track record, but how do we properly assess sustainability? I recommend you continue to research Jungheinrich to get a more holistic view of the stock by looking at:
Future Outlook: What are well-informed industry analysts predicting for JUN3’s future growth? Take a look at our free research report of analyst consensus for JUN3’s outlook.
Financial Health: Are JUN3’s operations financially sustainable? Balance sheets can be hard to analyze, which is why we’ve done it for you. Check out our financial health checks here.
Other High-Performing Stocks: Are there other stocks that provide better prospects with proven track records? Explore our free list of these great stocks here.
NB: Figures in this article are calculated using data from the trailing twelve months from 30 June 2018. This may not be consistent with full year annual report figures.
To help readers see past the short term volatility of the financial market, we aim to bring you a long-term focused research analysis purely driven by fundamental data. Note that our analysis does not factor in the latest price-sensitive company announcements.
The author is an independent contributor and at the time of publication had no position in the stocks mentioned. For errors that warrant correction please contact the editor at editorial-team@simplywallst.com.
