Should You Be Concerned With New York Community Bancorp Inc’s (NYSE:NYCB) -10.90% Earnings Drop?

When New York Community Bancorp Inc (NYSE:NYCB) released its most recent earnings update (31 December 2017), I compared it against two factor: its historical earnings track record, and the performance of its industry peers on average. Understanding how New York Community Bancorp performed requires a benchmark rather than trying to assess a standalone number at one point in time. Below is a quick commentary on how I see NYCB has performed. See our latest analysis for New York Community Bancorp
How Well Did NYCB Perform?
To account for any quarterly or half-yearly updates, I use the ‘latest twelve-month’ data, which annualizes the latest 6-month earnings release, or some times, the latest annual report is already the most recent financial data. This allows me to examine different companies on a similar basis, using new information. For New York Community Bancorp, its most recent earnings (trailing twelve month) is US$438.03M, which, against the previous year’s figure, has declined by -10.90%. Since these values are somewhat nearsighted, I have computed an annualized five-year value for New York Community Bancorp’s earnings, which stands at US$406.51M This means that while earnings declined from the prior year, over a longer period of time, New York Community Bancorp’s profits have been rising on average.
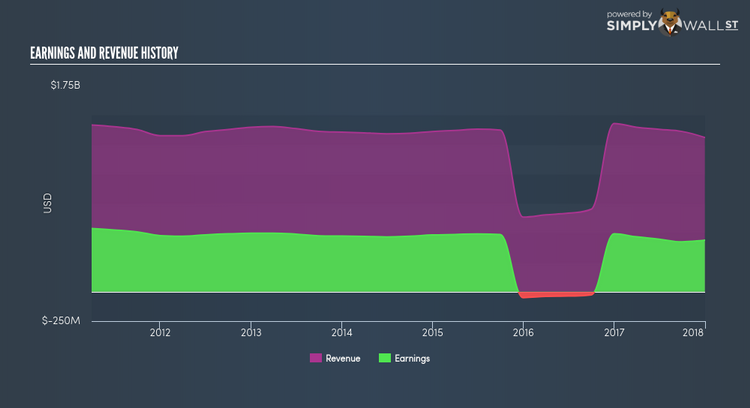
What’s enabled this growth? Well, let’s take a look at whether it is only a result of industry tailwinds, or if New York Community Bancorp has seen some company-specific growth. Although both top-line and bottom-line growth rates in the last few years, were, on average, negative, earnings were more so. While this has led to a margin contraction, it has lessened New York Community Bancorp’s earnings contraction. Inspecting growth from a sector-level, the US mortgage industry has been relatively flat in terms of earnings growth in the past twelve months, evening out from a robust 12.85% over the past five years. This means that whatever recent headwind the industry is facing, it’s hitting New York Community Bancorp harder than its peers.
What does this mean?
While past data is useful, it doesn’t tell the whole story. Companies that are profitable, but have volatile earnings, can have many factors impacting its business. I recommend you continue to research New York Community Bancorp to get a better picture of the stock by looking at:
1. Future Outlook: What are well-informed industry analysts predicting for NYCB’s future growth? Take a look at our free research report of analyst consensus for NYCB’s outlook.
2. Financial Health: Is NYCB’s operations financially sustainable? Balance sheets can be hard to analyze, which is why we’ve done it for you. Check out our financial health checks here.
3. Other High-Performing Stocks: Are there other stocks that provide better prospects with proven track records? Explore our free list of these great stocks here.
NB: Figures in this article are calculated using data from the trailing twelve months from 31 December 2017. This may not be consistent with full year annual report figures.
To help readers see pass the short term volatility of the financial market, we aim to bring you a long-term focused research analysis purely driven by fundamental data. Note that our analysis does not factor in the latest price sensitive company announcements.
The author is an independent contributor and at the time of publication had no position in the stocks mentioned.
