Are You Considering All The Risks For Caisse Régionale de Crédit Agricole Mutuel de Paris et d’Ile-de-France’s (EPA:CAF)?

Improving credit quality as a result of post-GFC recovery has led to a strong environment for growth in the banking sector. Economic growth impacts the stability of salaries and interest rate level which in turn affects borrowers’ demand for, and ability to repay, their loans. As a small-cap bank with a market capitalisation of €2.61b, Caisse Régionale de Crédit Agricole Mutuel de Paris et d’Ile-de-France’s (EPA:CAF) profit and value are directly affected by economic activity. Risk associate with repayment is measured by the level of bad debt which is an expense written off Caisse Régionale de Crédit Agricole Mutuel de Paris et d’Ile-de-France’s bottom line. Today I will take you through some bad debt and liability measures to analyse the level of risky assets held by the bank. Looking through a risk-lens is a useful way to assess the attractiveness of Caisse Régionale de Crédit Agricole Mutuel de Paris et d’Ile-de-France’s a stock investment. Check out our latest analysis for Caisse Régionale de Crédit Agricole Mutuel de Paris et d’Ile-de-France
Does Caisse Régionale de Crédit Agricole Mutuel de Paris et d’Ile-de-France Understand Its Own Risks?
Caisse Régionale de Crédit Agricole Mutuel de Paris et d’Ile-de-France’s forecasting and provisioning accuracy for its bad loans indicates it has a strong understanding of its own risk levels. If the level of provisioning covers 100% or more of the actual bad debt expense the bank writes off, then it is relatively accurate and prudent in its bad debt provisioning. With a bad loan to bad debt ratio of 122.41%, the bank has cautiously over-provisioned by 22.41%, which illustrates a safe and prudent forecasting methodology, and its ability to anticipate the factors contributing to its bad loan levels.
How Much Risk Is Too Much?
Caisse Régionale de Crédit Agricole Mutuel de Paris et d’Ile-de-France is engaging in risking lending practices if it is over-exposed to bad debt. Loans that cannot be recuperated by the bank, also known as bad loans, should typically form less than 3% of its total loans. Bad debt is written off when loans are not repaid. This is classified as an expense which directly impacts Caisse Régionale de Crédit Agricole Mutuel de Paris et d’Ile-de-France’s bottom line. A ratio of 0.95% indicates the bank faces relatively low chance of default and exhibits strong bad debt management.
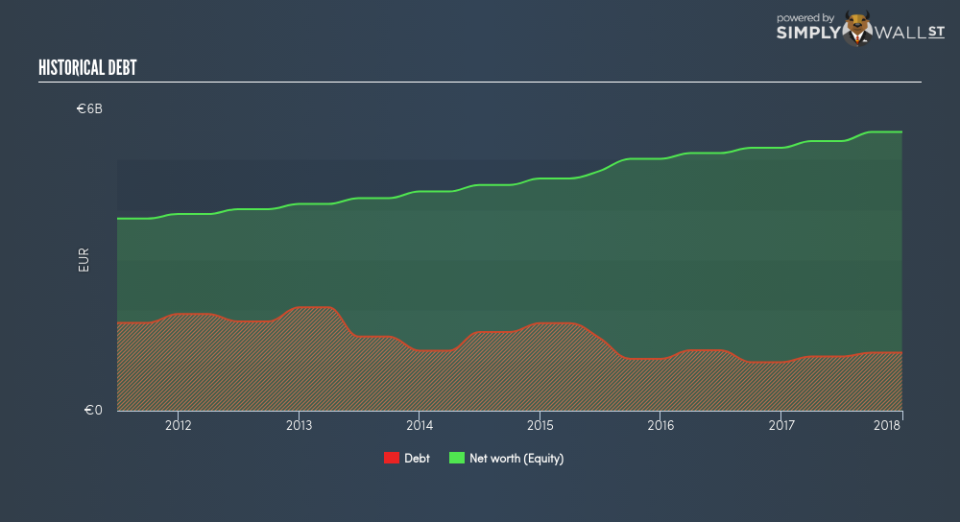
How Big Is Caisse Régionale de Crédit Agricole Mutuel de Paris et d’Ile-de-France’s Safety Net?

Caisse Régionale de Crédit Agricole Mutuel de Paris et d’Ile-de-France makes money by lending out its various forms of borrowings. Deposits from customers tend to bear the lowest risk given the relatively stable amount available and interest rate. As a rule, a bank is considered less risky if it holds a higher level of deposits. Caisse Régionale de Crédit Agricole Mutuel de Paris et d’Ile-de-France’s total deposit level of 95.09% of its total liabilities is very high and is well-above the sensible level of 50% for financial institutions. This may mean the bank is too cautious with its level of its safer form of borrowing and has plenty of headroom to take on risker forms of liability.
Next Steps:
The recent acquisition is expected to bring more opportunities for CAF, which in turn should lead to stronger growth. I would stay up-to-date on how this decision will affect the future of the business in terms of earnings growth and financial health. The list below is my go-to checks for CAF. I use Simply Wall St’s platform to keep informed about any changes in the company and market sentiment, and also use their data as the basis for my articles.
Future Outlook: What are well-informed industry analysts predicting for CAF’s future growth? Take a look at our free research report of analyst consensus for CAF’s outlook.
Historical Performance: What has CAF’s returns been like over the past? Go into more detail in the past track record analysis and take a look at the free visual representations of our analysis for more clarity.
Other High-Performing Stocks: Are there other stocks that provide better prospects with proven track records? Explore our free list of these great stocks here.
To help readers see pass the short term volatility of the financial market, we aim to bring you a long-term focused research analysis purely driven by fundamental data. Note that our analysis does not factor in the latest price sensitive company announcements.
The author is an independent contributor and at the time of publication had no position in the stocks mentioned.
