Constellation Brands Inc (NYSE:STZ) Delivered A Better ROE Than The Industry, Here’s Why

This analysis is intended to introduce important early concepts to people who are starting to invest and want a simplistic look at the return on Constellation Brands Inc (NYSE:STZ) stock.
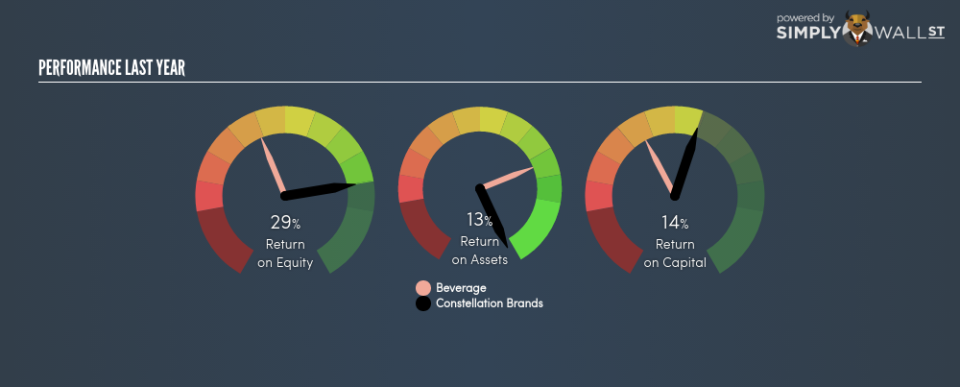
Constellation Brands Inc (NYSE:STZ) outperformed the Distillers and Vintners industry on the basis of its ROE – producing a higher 28.91% relative to the peer average of 12.43% over the past 12 months. Superficially, this looks great since we know that STZ has generated big profits with little equity capital; however, ROE doesn’t tell us how much STZ has borrowed in debt. Today, we’ll take a closer look at some factors like financial leverage to see how sustainable STZ’s ROE is. View out our latest analysis for Constellation Brands
Peeling the layers of ROE – trisecting a company’s profitability
Return on Equity (ROE) weighs Constellation Brands’s profit against the level of its shareholders’ equity. An ROE of 28.91% implies $0.29 returned on every $1 invested. While a higher ROE is preferred in most cases, there are several other factors we should consider before drawing any conclusions.
Return on Equity = Net Profit ÷ Shareholders Equity
ROE is measured against cost of equity in order to determine the efficiency of Constellation Brands’s equity capital deployed. Its cost of equity is 8.59%. Since Constellation Brands’s return covers its cost in excess of 20.32%, its use of equity capital is efficient and likely to be sustainable. Simply put, Constellation Brands pays less for its capital than what it generates in return. ROE can be dissected into three distinct ratios: net profit margin, asset turnover, and financial leverage. This is called the Dupont Formula:
Dupont Formula
ROE = profit margin × asset turnover × financial leverage
ROE = (annual net profit ÷ sales) × (sales ÷ assets) × (assets ÷ shareholders’ equity)
ROE = annual net profit ÷ shareholders’ equity
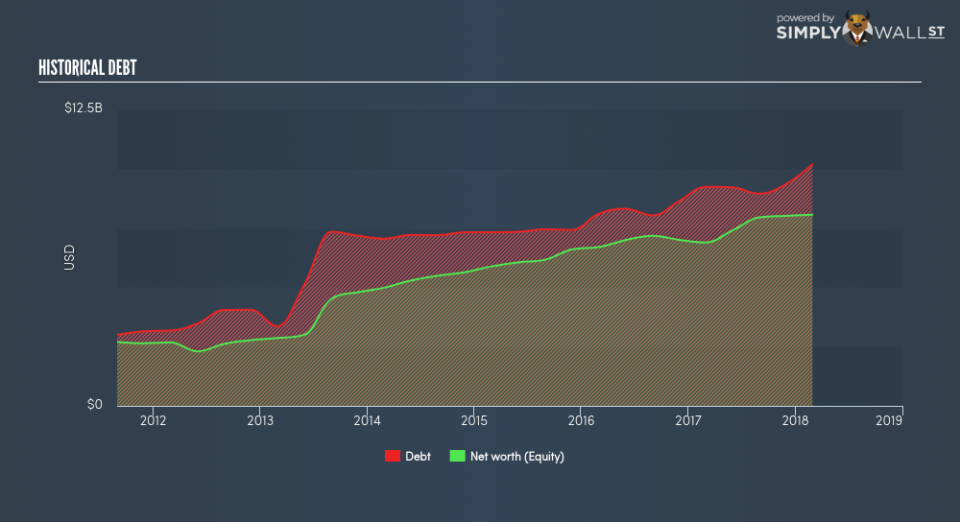
Essentially, profit margin shows how much money the company makes after paying for all its expenses. Asset turnover reveals how much revenue can be generated from Constellation Brands’s asset base. And finally, financial leverage is simply how much of assets are funded by equity, which exhibits how sustainable the company’s capital structure is. Since financial leverage can artificially inflate ROE, we need to look at how much debt Constellation Brands currently has. Currently the debt-to-equity ratio stands at a balanced 126.34%, which means its above-average ROE is driven by its ability to grow its profit without a significant debt burden.
Next Steps:
ROE is one of many ratios which meaningfully dissects financial statements, which illustrates the quality of a company. Constellation Brands’s ROE is impressive relative to the industry average and also covers its cost of equity. ROE is not likely to be inflated by excessive debt funding, giving shareholders more conviction in the sustainability of high returns. Although ROE can be a useful metric, it is only a small part of diligent research.
For Constellation Brands, I’ve compiled three pertinent aspects you should further research:
Financial Health: Does it have a healthy balance sheet? Take a look at our free balance sheet analysis with six simple checks on key factors like leverage and risk.
Valuation: What is Constellation Brands worth today? Is the stock undervalued, even when its growth outlook is factored into its intrinsic value? The intrinsic value infographic in our free research report helps visualize whether Constellation Brands is currently mispriced by the market.
Other High-Growth Alternatives : Are there other high-growth stocks you could be holding instead of Constellation Brands? Explore our interactive list of stocks with large growth potential to get an idea of what else is out there you may be missing!
To help readers see pass the short term volatility of the financial market, we aim to bring you a long-term focused research analysis purely driven by fundamental data. Note that our analysis does not factor in the latest price sensitive company announcements.
The author is an independent contributor and at the time of publication had no position in the stocks mentioned.
