Can Constellation Software Inc’s (TSE:CSU) ROE Continue To Surpass The Industry Average?

Constellation Software Inc (TSX:CSU) outperformed the Application Software industry on the basis of its ROE – producing a higher 43.52% relative to the peer average of 17.08% over the past 12 months. Superficially, this looks great since we know that CSU has generated big profits with little equity capital; however, ROE doesn’t tell us how much CSU has borrowed in debt. Today, we’ll take a closer look at some factors like financial leverage to see how sustainable CSU’s ROE is. See our latest analysis for Constellation Software
What you must know about ROE
Return on Equity (ROE) is a measure of Constellation Software’s profit relative to its shareholders’ equity. For example, if the company invests CA$1 in the form of equity, it will generate CA$0.44 in earnings from this. In most cases, a higher ROE is preferred; however, there are many other factors we must consider prior to making any investment decisions.
Return on Equity = Net Profit ÷ Shareholders Equity
ROE is assessed against cost of equity, which is measured using the Capital Asset Pricing Model (CAPM) – but let’s not dive into the details of that today. For now, let’s just look at the cost of equity number for Constellation Software, which is 8.43%. This means Constellation Software returns enough to cover its own cost of equity, with a buffer of 35.10%. This sustainable practice implies that the company pays less for its capital than what it generates in return. ROE can be dissected into three distinct ratios: net profit margin, asset turnover, and financial leverage. This is called the Dupont Formula:
Dupont Formula
ROE = profit margin × asset turnover × financial leverage
ROE = (annual net profit ÷ sales) × (sales ÷ assets) × (assets ÷ shareholders’ equity)
ROE = annual net profit ÷ shareholders’ equity
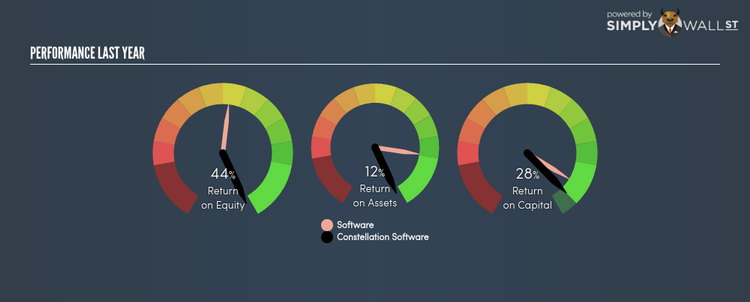
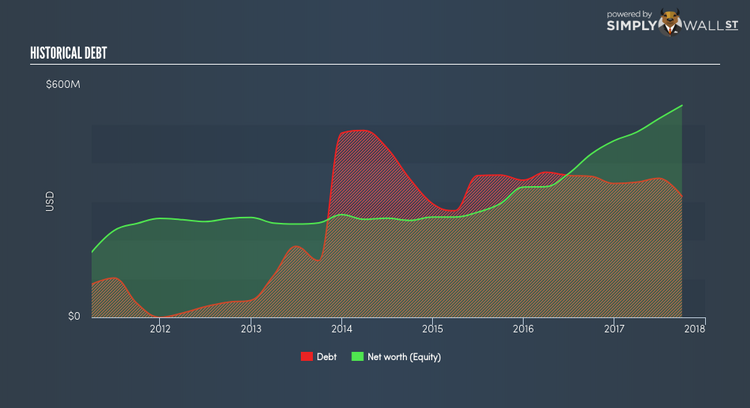
Basically, profit margin measures how much of revenue trickles down into earnings which illustrates how efficient the business is with its cost management. The other component, asset turnover, illustrates how much revenue Constellation Software can make from its asset base. Finally, financial leverage will be our main focus today. It shows how much of assets are funded by equity and can show how sustainable the company’s capital structure is. Since ROE can be inflated by excessive debt, we need to examine Constellation Software’s debt-to-equity level. The debt-to-equity ratio currently stands at a sensible 57.13%, meaning the above-average ROE is due to its capacity to produce profit growth without a huge debt burden.
What this means for you:
Are you a shareholder? CSU’s above-industry ROE is encouraging, and is also in excess of its cost of equity. Since its high ROE is not likely driven by high debt, it might be a good time to top up on your current holdings if your fundamental research reaffirms this analysis. If you’re looking for new ideas for high-returning stocks, you should take a look at our free platform to see the list of stocks with Return on Equity over 20%.
Are you a potential investor? If CSU has been on your watch list for a while, making an investment decision based on ROE alone is unwise. I recommend you do additional fundamental analysis by looking through our most recent infographic report on Constellation Software to help you make a more informed investment decision.
To help readers see pass the short term volatility of the financial market, we aim to bring you a long-term focused research analysis purely driven by fundamental data. Note that our analysis does not factor in the latest price sensitive company announcements.
The author is an independent contributor and at the time of publication had no position in the stocks mentioned.
