The Cooper Companies, Inc.'s (NYSE:COO) Stock Is Going Strong: Is the Market Following Fundamentals?
Cooper Companies' (NYSE:COO) stock is up by a considerable 13% over the past three months. Given that the market rewards strong financials in the long-term, we wonder if that is the case in this instance. In this article, we decided to focus on Cooper Companies' ROE.
ROE or return on equity is a useful tool to assess how effectively a company can generate returns on the investment it received from its shareholders. In short, ROE shows the profit each dollar generates with respect to its shareholder investments.
See our latest analysis for Cooper Companies
How Is ROE Calculated?
The formula for ROE is:
Return on Equity = Net Profit (from continuing operations) ÷ Shareholders' Equity
So, based on the above formula, the ROE for Cooper Companies is:
38% = US$2.2b ÷ US$6.0b (Based on the trailing twelve months to January 2021).
The 'return' is the profit over the last twelve months. One way to conceptualize this is that for each $1 of shareholders' capital it has, the company made $0.38 in profit.
Why Is ROE Important For Earnings Growth?
We have already established that ROE serves as an efficient profit-generating gauge for a company's future earnings. Based on how much of its profits the company chooses to reinvest or "retain", we are then able to evaluate a company's future ability to generate profits. Assuming everything else remains unchanged, the higher the ROE and profit retention, the higher the growth rate of a company compared to companies that don't necessarily bear these characteristics.
Cooper Companies' Earnings Growth And 38% ROE
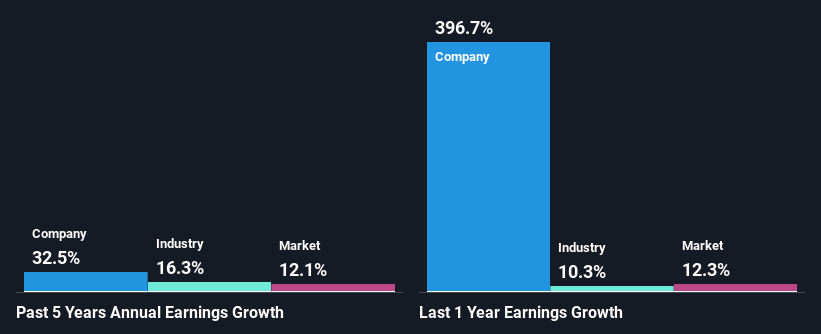
To begin with, Cooper Companies has a pretty high ROE which is interesting. Additionally, the company's ROE is higher compared to the industry average of 12% which is quite remarkable. As a result, Cooper Companies' exceptional 32% net income growth seen over the past five years, doesn't come as a surprise.
Next, on comparing with the industry net income growth, we found that Cooper Companies' growth is quite high when compared to the industry average growth of 16% in the same period, which is great to see.
Earnings growth is an important metric to consider when valuing a stock. It’s important for an investor to know whether the market has priced in the company's expected earnings growth (or decline). By doing so, they will have an idea if the stock is headed into clear blue waters or if swampy waters await. If you're wondering about Cooper Companies''s valuation, check out this gauge of its price-to-earnings ratio, as compared to its industry.
Is Cooper Companies Using Its Retained Earnings Effectively?
Cooper Companies has a really low three-year median payout ratio of 0.9%, meaning that it has the remaining 99% left over to reinvest into its business. So it seems like the management is reinvesting profits heavily to grow its business and this reflects in its earnings growth number.
Additionally, Cooper Companies has paid dividends over a period of at least ten years which means that the company is pretty serious about sharing its profits with shareholders. Existing analyst estimates suggest that the company's future payout ratio is expected to drop to 0.4% over the next three years. Still forecasts suggest that Cooper Companies' future ROE will drop to 11% even though the the company's payout ratio is expected to decrease. This suggests that there could be other factors could driving the anticipated decline in the company's ROE.
Conclusion
On the whole, we feel that Cooper Companies' performance has been quite good. Specifically, we like that the company is reinvesting a huge chunk of its profits at a high rate of return. This of course has caused the company to see substantial growth in its earnings. That being so, according to the latest industry analyst forecasts, the company's earnings are expected to shrink in the future. To know more about the latest analysts predictions for the company, check out this visualization of analyst forecasts for the company.
This article by Simply Wall St is general in nature. It does not constitute a recommendation to buy or sell any stock, and does not take account of your objectives, or your financial situation. We aim to bring you long-term focused analysis driven by fundamental data. Note that our analysis may not factor in the latest price-sensitive company announcements or qualitative material. Simply Wall St has no position in any stocks mentioned.
Have feedback on this article? Concerned about the content? Get in touch with us directly. Alternatively, email editorial-team (at) simplywallst.com.
