Could Denali Therapeutics Inc’s (NASDAQ:DNLI) Investor Composition Impacts Your Returns?

If you want to know who really controls Denali Therapeutics Inc (NASDAQ:DNLI), then you’ll have to look at the makeup of its share registry. Generally speaking, as a company grows, institutions will increase their ownership. Conversely, insiders often decrease their ownership over time. I generally like to see some degree of insider ownership, even if only a little. As Nassim Nicholas Taleb said, ‘Don’t tell me what you think, tell me what you have in your portfolio.’
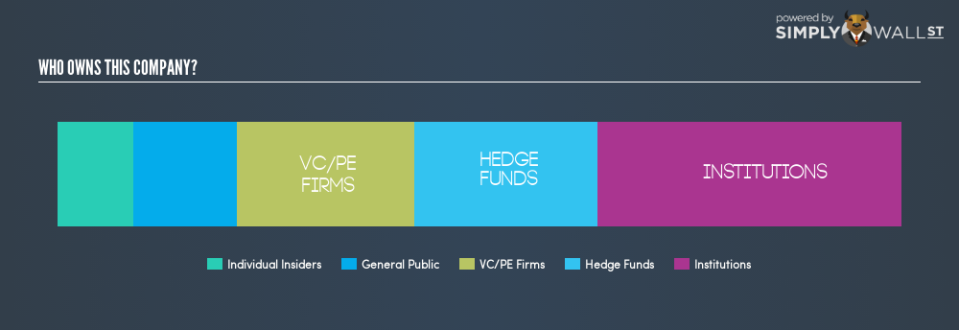
With a market capitalization of US$1.98b, Denali Therapeutics is a decent size, so it is probably on the radar of institutional investors. Taking a look at the our data on the ownership groups (below), it’s seems that institutions are noticeable on the share registry. Let’s delve deeper into each type of owner, to discover more about DNLI.
Check out our latest analysis for Denali Therapeutics
What Does The Institutional Ownership Tell Us About Denali Therapeutics?
Institutional investors commonly compare their own returns to the returns of a commonly followed index. So they generally do consider buying larger companies that are included in the relevant benchmark index.
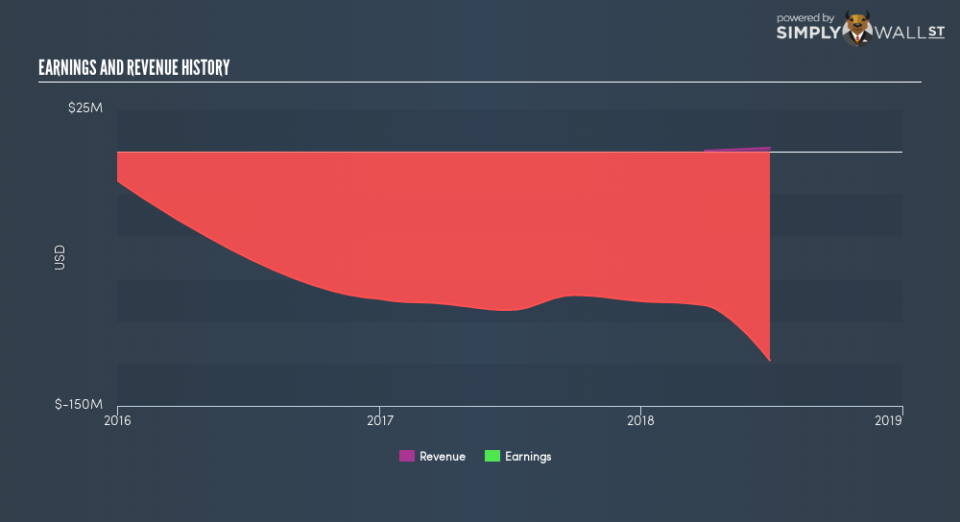
We can see that Denali Therapeutics does have institutional investors; and they hold 35.9% of the stock. This can indicate that the company has a certain degree of credibility in the investment community. However, it is best to be wary of relying on the supposed validation that comes with institutional investors. They too, get it wrong sometimes. If multiple institutions change their view on a stock at the same time, you could see the share price drop fast. It’s therefore worth looking at Denali Therapeutics’s earnings history, below. Of course, the future is what really matters.
It looks like hedge funds own 21.7% of Denali Therapeutics shares. That worth noting, since hedge funds are often quite active investors, who may try to influence management. Many want to see value creation (and a higher share price) in the short term or medium term. There is a little analyst coverage of the stock, but not much. So there is room for it to gain more coverage.
Insider Ownership Of Denali Therapeutics
The definition of an insider can differ slightly between different countries, but members of the board of directors always count. Company management run the business, but the CEO will answer to the board, even if he or she is a member of it.
Most consider insider ownership a positive because it can indicate the board is well aligned with other shareholders. However, on some occasions too much power is concentrated within this group.
I can report that insiders do own shares in Denali Therapeutics Inc. This is a big company, so it is good to see this level of alignment. Insiders own US$181.4m worth of shares (at current prices). Most would say this shows alignment of interests between shareholders and the board. Still, it might be worth checking if those insiders have been selling.
General Public Ownership
With a 12.2% ownership, the general public have some degree of sway over DNLI. While this group can’t necessarily call the shots, it can certainly have a real influence on how the company is run.
Private Equity Ownership
Private equity firms hold a 21.1% stake in DNLI. This suggests they can be influential in key policy decisions. Sometimes we see private equity stick around for the long term, but generally speaking they have a shorter investment horizon and — as the name suggests — don’t invest in public companies much. After some time they may look to sell and redeploy capital elsewhere.
Next Steps:
I find it very interesting to look at who exactly owns a company. But to truly gain insight, we need to consider other information, too.
I like to dive deeper into how a company has performed in the past. You can access this interactive graph of past earnings, revenue and cash flow, for free .
But ultimately it is the future, not the past, that will determine how well the owners of this business will do. Therefore we think it advisable to take a look at this free report showing whether analysts are predicting a brighter future.
NB: Figures in this article are calculated using data from the last twelve months, which refer to the 12-month period ending on the last date of the month the financial statement is dated. This may not be consistent with full year annual report figures.
To help readers see past the short term volatility of the financial market, we aim to bring you a long-term focused research analysis purely driven by fundamental data. Note that our analysis does not factor in the latest price-sensitive company announcements.
The author is an independent contributor and at the time of publication had no position in the stocks mentioned. For errors that warrant correction please contact the editor at editorial-team@simplywallst.com.
