Could JPJ Group plc's (LON:JPJ) Investor Composition Influence The Stock Price?

Want to participate in a short research study? Help shape the future of investing tools and you could win a $250 gift card!
A look at the shareholders of JPJ Group plc (LON:JPJ) can tell us which group is most powerful. Large companies usually have institutions as shareholders, and we usually see insiders owning shares in smaller companies. I generally like to see some degree of insider ownership, even if only a little. As Nassim Nicholas Taleb said, 'Don’t tell me what you think, tell me what you have in your portfolio.'
JPJ Group is a smaller company with a market capitalization of UK£551m, so it may still be flying under the radar of many institutional investors. Our analysis of the ownership of the company, below, shows that institutions own shares in the company. Let's delve deeper into each type of owner, to discover more about JPJ.
Check out our latest analysis for JPJ Group

What Does The Institutional Ownership Tell Us About JPJ Group?
Institutions typically measure themselves against a benchmark when reporting to their own investors, so they often become more enthusiastic about a stock once it's included in a major index. We would expect most companies to have some institutions on the register, especially if they are growing.
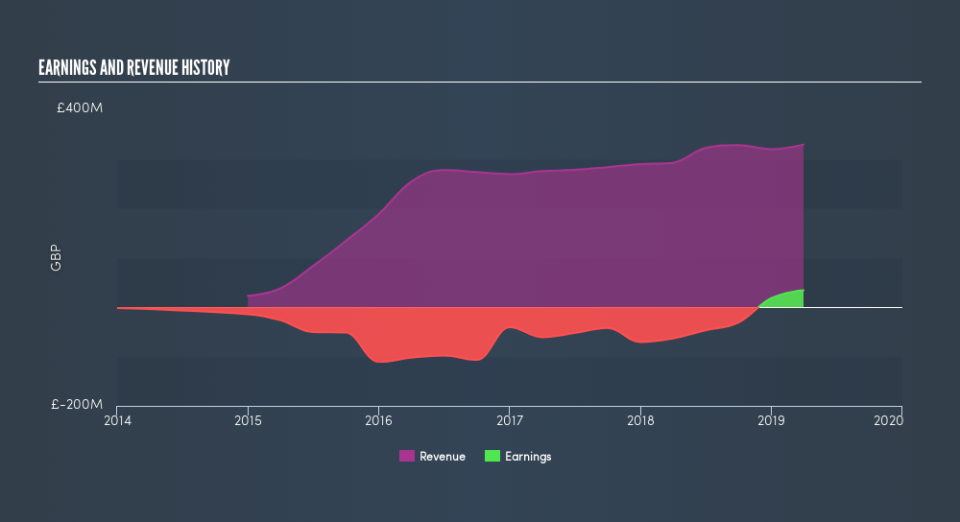
JPJ Group already has institutions on the share registry. Indeed, they own 68% of the company. This suggests some credibility amongst professional investors. But we can't rely on that fact alone, since institutions make bad investments sometimes, just like everyone does. When multiple institutions own a stock, there's always a risk that they are in a 'crowded trade'. When such a trade goes wrong, multiple parties may compete to sell stock fast. This risk is higher in a company without a history of growth. You can see JPJ Group's historic earnings and revenue, below, but keep in mind there's always more to the story.
Investors should note that institutions actually own more than half the company, so they can collectively wield significant power. It would appear that 8.1% of JPJ Group shares are controlled by hedge funds. That worth noting, since hedge funds are often quite active investors, who may try to influence management. Many want to see value creation (and a higher share price) in the short term or medium term. Quite a few analysts cover the stock, so you could look into forecast growth quite easily.
Insider Ownership Of JPJ Group
The definition of an insider can differ slightly between different countries, but members of the board of directors always count. Company management run the business, but the CEO will answer to the board, even if he or she is a member of it.
Insider ownership is positive when it signals leadership are thinking like the true owners of the company. However, high insider ownership can also give immense power to a small group within the company. This can be negative in some circumstances.
We can see that insiders own shares in JPJ Group plc. In their own names, insiders own UK£47m worth of stock in the UK£551m company. This shows at least some alignment. You can click here to see if those insiders have been buying or selling.
General Public Ownership
The general public, with a 11% stake in the company, will not easily be ignored. While this group can't necessarily call the shots, it can certainly have a real influence on how the company is run.
Public Company Ownership
It appears to us that public companies own 4.8% of JPJ. We can't be certain, but this is quite possible this is a strategic stake. The businesses may be similar, or work together.
Next Steps:
While it is well worth considering the different groups that own a company, there are other factors that are even more important.
I like to dive deeper into how a company has performed in the past. You can find historic revenue and earnings in this detailed graph.
If you would prefer discover what analysts are predicting in terms of future growth, do not miss this free report on analyst forecasts.
NB: Figures in this article are calculated using data from the last twelve months, which refer to the 12-month period ending on the last date of the month the financial statement is dated. This may not be consistent with full year annual report figures.
We aim to bring you long-term focused research analysis driven by fundamental data. Note that our analysis may not factor in the latest price-sensitive company announcements or qualitative material.
If you spot an error that warrants correction, please contact the editor at editorial-team@simplywallst.com. This article by Simply Wall St is general in nature. It does not constitute a recommendation to buy or sell any stock, and does not take account of your objectives, or your financial situation. Simply Wall St has no position in the stocks mentioned. Thank you for reading.
