Could The Market Be Wrong About Dynacor Group Inc. (TSE:DNG) Given Its Attractive Financial Prospects?
Dynacor Group (TSE:DNG) has had a rough three months with its share price down 18%. But if you pay close attention, you might gather that its strong financials could mean that the stock could potentially see an increase in value in the long-term, given how markets usually reward companies with good financial health. In this article, we decided to focus on Dynacor Group's ROE.
Return on equity or ROE is an important factor to be considered by a shareholder because it tells them how effectively their capital is being reinvested. In simpler terms, it measures the profitability of a company in relation to shareholder's equity.
See our latest analysis for Dynacor Group
How Is ROE Calculated?
Return on equity can be calculated by using the formula:
Return on Equity = Net Profit (from continuing operations) ÷ Shareholders' Equity
So, based on the above formula, the ROE for Dynacor Group is:
16% = US$12m ÷ US$78m (Based on the trailing twelve months to September 2022).
The 'return' is the yearly profit. One way to conceptualize this is that for each CA$1 of shareholders' capital it has, the company made CA$0.16 in profit.
What Is The Relationship Between ROE And Earnings Growth?
So far, we've learned that ROE is a measure of a company's profitability. Depending on how much of these profits the company reinvests or "retains", and how effectively it does so, we are then able to assess a company’s earnings growth potential. Assuming everything else remains unchanged, the higher the ROE and profit retention, the higher the growth rate of a company compared to companies that don't necessarily bear these characteristics.
Dynacor Group's Earnings Growth And 16% ROE
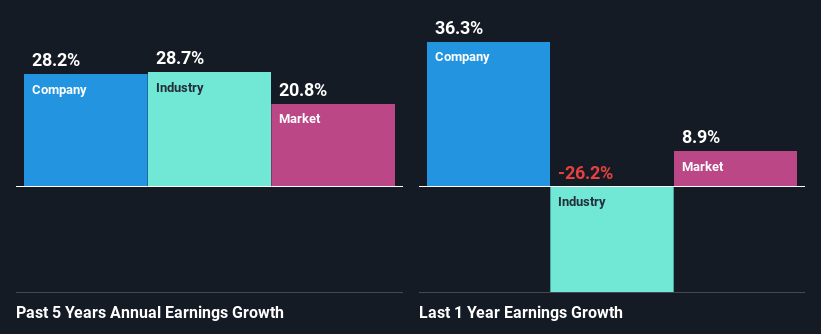
To begin with, Dynacor Group seems to have a respectable ROE. On comparing with the average industry ROE of 12% the company's ROE looks pretty remarkable. Probably as a result of this, Dynacor Group was able to see an impressive net income growth of 28% over the last five years. We reckon that there could also be other factors at play here. For instance, the company has a low payout ratio or is being managed efficiently.
We then performed a comparison between Dynacor Group's net income growth with the industry, which revealed that the company's growth is similar to the average industry growth of 29% in the same period.
The basis for attaching value to a company is, to a great extent, tied to its earnings growth. It’s important for an investor to know whether the market has priced in the company's expected earnings growth (or decline). Doing so will help them establish if the stock's future looks promising or ominous. One good indicator of expected earnings growth is the P/E ratio which determines the price the market is willing to pay for a stock based on its earnings prospects. So, you may want to check if Dynacor Group is trading on a high P/E or a low P/E, relative to its industry.
Is Dynacor Group Making Efficient Use Of Its Profits?
Dynacor Group's ' three-year median payout ratio is on the lower side at 23% implying that it is retaining a higher percentage (77%) of its profits. So it looks like Dynacor Group is reinvesting profits heavily to grow its business, which shows in its earnings growth.
Additionally, Dynacor Group has paid dividends over a period of four years which means that the company is pretty serious about sharing its profits with shareholders.
Summary
In total, we are pretty happy with Dynacor Group's performance. Particularly, we like that the company is reinvesting heavily into its business, and at a high rate of return. Unsurprisingly, this has led to an impressive earnings growth. If the company continues to grow its earnings the way it has, that could have a positive impact on its share price given how earnings per share influence long-term share prices. Not to forget, share price outcomes are also dependent on the potential risks a company may face. So it is important for investors to be aware of the risks involved in the business. You can see the 2 risks we have identified for Dynacor Group by visiting our risks dashboard for free on our platform here.
Have feedback on this article? Concerned about the content? Get in touch with us directly. Alternatively, email editorial-team (at) simplywallst.com.
This article by Simply Wall St is general in nature. We provide commentary based on historical data and analyst forecasts only using an unbiased methodology and our articles are not intended to be financial advice. It does not constitute a recommendation to buy or sell any stock, and does not take account of your objectives, or your financial situation. We aim to bring you long-term focused analysis driven by fundamental data. Note that our analysis may not factor in the latest price-sensitive company announcements or qualitative material. Simply Wall St has no position in any stocks mentioned.
Join A Paid User Research Session
You’ll receive a US$30 Amazon Gift card for 1 hour of your time while helping us build better investing tools for the individual investors like yourself. Sign up here
