Could The Sarama Resources Ltd (CVE:SWA) Ownership Structure Tell Us Something Useful?

The big shareholder groups in Sarama Resources Ltd (CVE:SWA) have power over the company. Institutions often own shares in more established companies, while it's not unusual to see insiders own a fair bit of smaller companies. I generally like to see some degree of insider ownership, even if only a little. As Nassim Nicholas Taleb said, 'Don’t tell me what you think, tell me what you have in your portfolio.
Sarama Resources is a smaller company with a market capitalization of CA$20m, so it may still be flying under the radar of many institutional investors. Taking a look at our data on the ownership groups (below), it's seems that institutions are noticeable on the share registry. Let's take a closer look to see what the different types of shareholder can tell us about SWA.
View our latest analysis for Sarama Resources
What Does The Institutional Ownership Tell Us About Sarama Resources?
Institutions typically measure themselves against a benchmark when reporting to their own investors, so they often become more enthusiastic about a stock once it's included in a major index. We would expect most companies to have some institutions on the register, especially if they are growing.
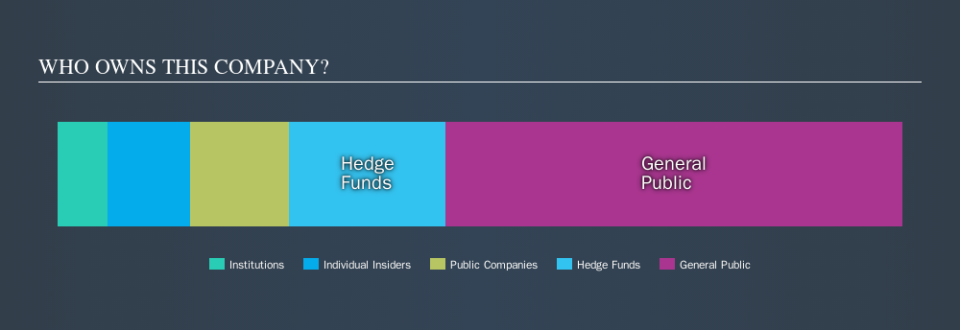
We can see that Sarama Resources does have institutional investors; and they hold 6.1% of the stock. This implies the analysts working for those institutions have looked at the stock and they like it. But just like anyone else, they could be wrong. If multiple institutions change their view on a stock at the same time, you could see the share price drop fast. It's therefore worth looking at Sarama Resources's earnings history, below. Of course, the future is what really matters.

Our data indicates that hedge funds own 18% of Sarama Resources. That's interesting, because hedge funds can be quite active and activist. Many look for medium term catalysts that will drive the share price higher. Our information suggests that there isn't any analyst coverage of the stock, so it is probably little known.
Insider Ownership Of Sarama Resources
The definition of an insider can differ slightly between different countries, but members of the board of directors always count. Company management run the business, but the CEO will answer to the board, even if he or she is a member of it.
Insider ownership is positive when it signals leadership are thinking like the true owners of the company. However, high insider ownership can also give immense power to a small group within the company. This can be negative in some circumstances.
We can see that insiders own shares in Sarama Resources Ltd. It has a market capitalization of just CA$20m, and insiders have CA$1.9m worth of shares, in their own names. Some would say this shows alignment of interests between shareholders and the board, though I generally prefer to see bigger insider holdings. But it might be worth checking if those insiders have been selling.
General Public Ownership
The general public, who are mostly retail investors, collectively hold 54% of Sarama Resources shares. This size of ownership gives retail investors collective power. They can and probably do influence decisions on executive compensation, dividend policies and proposed business acquisitions.
Public Company Ownership
Public companies currently own 12% of SWA stock. This may be a strategic interest and the two companies may have related business interests. It could be that they have de-merged. This holding is probably worth investigating further.
Next Steps:
It's always worth thinking about the different groups who own shares in a company. But to understand Sarama Resources better, we need to consider many other factors.
I like to dive deeper into how a company has performed in the past. You can access this interactive graph of past earnings, revenue and cash flow for free.
Of course this may not be the best stock to buy. So take a peek at this free free list of interesting companies.
NB: Figures in this article are calculated using data from the last twelve months, which refer to the 12-month period ending on the last date of the month the financial statement is dated. This may not be consistent with full year annual report figures.
We aim to bring you long-term focused research analysis driven by fundamental data. Note that our analysis may not factor in the latest price-sensitive company announcements or qualitative material.
If you spot an error that warrants correction, please contact the editor at editorial-team@simplywallst.com. This article by Simply Wall St is general in nature. It does not constitute a recommendation to buy or sell any stock, and does not take account of your objectives, or your financial situation. Simply Wall St has no position in the stocks mentioned. Thank you for reading.
