Cross-Sector: Market Data Highlights
CROSS-SECTOR
DATA REPORT
29 April 2021
CLIENT SERVICES
Americas
1-212-553-1653
Asia Pacific
852-3551-3077
Japan
81-3-5408-4100
EMEA
44-20-7772-5454
Cross-Sector
Market Data Highlights
The latest market data from Weekly Market Outlook. Click
for access to the full WMO.
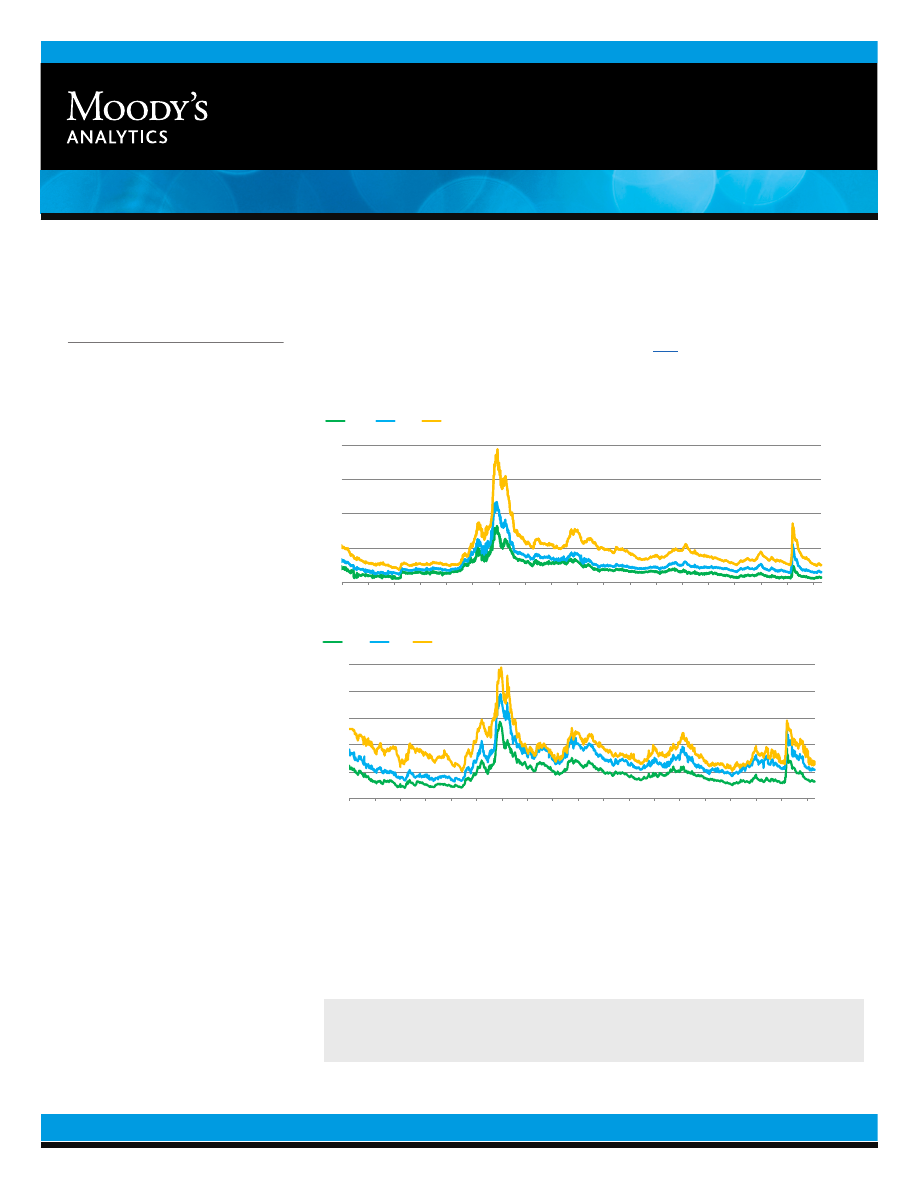
SPREADS
0
200
400
600
800
0
200
400
600
800
2003 2004 2005 2006 2007 2008 2009 2010 2011 2012 2013 2014 2015 2016 2017 2018 2019 2020 2021
Spread (bp)
Spread (bp)
Aa2
A2
Baa2
Source: Moody's
Figure 1: 5-Year Median Spreads-Global Data (High Grade)
0
400
800
1,200
1,600
2,000
0
400
800
1,200
1,600
2,000
2003 2004 2005 2006 2007 2008 2009 2010 2011 2012 2013 2014 2015 2016 2017 2018 2019 2020 2021
Spread (bp)
Spread (bp)
Ba2
B2
Caa-C
Source: Moody's
Figure 2: 5-Year Median Spreads-Global Data (High Yield)
Moody’s Analytics markets and distributes all Moody’s Capital Markets Research, Inc. materials. Moody’s Capital Markets
Research,Inc. is a subsidiary of Moody’s Corporation. Moody’s Analytics does not provide investment advisory services or
products. For further detail, please see the last page.
MOODY'S ANALYTICS
CROSS-SECTOR
CDS MOVERS
CDS Implied Rating Rises
Issuer
Apr. 28
Apr. 21
Senior Ratings
Archer-Daniels-Midland Company
A2
Baa1
A2
Comcast Corporation
A2
A3
A3
American Express Credit Corporation
A2
A3
A2
Occidental Petroleum Corporation
B1
B2
Ba2
Capital One Financial Corporation
Baa2
Baa3
Baa1
United Parcel Service, Inc.
Aa3
A1
A2
Tenet Healthcare Corporation
B1
B2
Caa1
Crown Castle International Corp.
Baa2
Baa3
Baa3
ViacomCBS Inc.
Baa2
Baa3
Baa2
Dish DBS Corporation
B3
Caa1
B2
CDS Implied Rating Declines
Issuer
Apr. 28
Apr. 21
Senior Ratings
Kroger Co. (The)
Baa1
A2
Baa1
Conagra Brands, Inc.
Baa2
A3
Baa3
McDonald's Corporation
A1
Aa3
Baa1
Exxon Mobil Corporation
A2
A1
Aa2
Procter & Gamble Company (The)
Aa3
Aa2
Aa3
Johnson & Johnson
Aa2
Aa1
Aaa
Amazon.com, Inc.
A3
A2
A2
Amgen Inc.
A2
A1
Baa1
Burlington Northern Santa Fe, LLC
A1
Aa3
A3
CCO Holdings, LLC
Ba2
Ba1
B1
CDS Spread Increases
Issuer
Senior Ratings
Apr. 28
Apr. 21
Spread Diff
Staples, Inc.
B3
711
692
18
R.R. Donnelley & Sons Company
B3
476
463
13
Beazer Homes USA, Inc.
B3
314
305
9
Mattel, Inc.
Ba2
223
215
8
Colgate-Palmolive Company
Aa3
34
27
7
Amkor Technology, Inc.
B1
135
128
7
Kroger Co. (The)
Baa1
49
43
6
Conagra Brands, Inc.
Baa3
54
48
6
Yum! Brands Inc.
Ba3
92
87
6
International Game Technology
B3
282
276
6
CDS Spread Decreases
Issuer
Senior Ratings
Apr. 28
Apr. 21
Spread Diff
Tenet Healthcare Corporation
Caa1
258
313
-55
Apache Corporation
Ba1
260
310
-51
Nabors Industries , Inc.
Caa2
998
1,045
-47
Occidental Petroleum Corporation
Ba2
274
305
-31
Realogy Group LLC
Caa1
369
395
-26
Dish DBS Corporation
B2
343
367
-24
Pitney Bowes Inc.
B1
409
431
-23
United States Steel Corporation
Caa1
390
408
-19
Juniper Networks, Inc.
Baa2
93
112
-19
United Airlines Holdings, Inc.
Ba3
400
419
-18
Source: Moody's, CMA
CDS Spreads
CDS Implied Ratings
CDS Implied Ratings
CDS Spreads
2 29 April 2021
Cross-Sector: Market Data Highlights

MOODY'S ANALYTICS
CROSS-SECTOR
CDS Implied Rating Rises
Issuer
Apr. 28
Apr. 21
Senior Ratings
Bayerische Landesbank
A1
Baa2
Aa3
Schaeffler Finance B.V.
A2
Baa1
Ba2
BNP Paribas
A1
A2
Aa3
National Grid plc
A1
A2
Baa2
Severn Trent Plc
Baa2
Baa3
Baa2
Thales
A3
Baa1
A2
Vedanta Resources Limited
Ca
C
Caa1
CMA CGM S.A.
Caa1
Caa2
B3
Legrand France S.A.
A2
A3
A3
Italy , Government of
Baa3
Baa3
Baa3
CDS Implied Rating Declines
Issuer
Apr. 28
Apr. 21
Senior Ratings
Rabobank
Aa3
Aa2
Aa3
Barclays PLC
Baa2
Baa1
Baa2
Portugal , Government of
A1
Aa3
Baa3
UniCredit S.p.A .
Baa3
Baa2
Baa1
Svenska Handelsbanken AB
Aa3
Aa2
Aa2
Swedbank AB
A1
Aa3
Aa3
RCI Banque
Ba3
Ba2
Baa2
ENGIE SA
A2
A1
Baa1
Compagnie de Saint-Gobain SA
A3
A2
Baa2
SSE plc
A3
A2
Baa1
CDS Spread Increases
Issuer
Senior Ratings
Apr. 28
Apr. 21
Spread Diff
Boparan Finance plc
Caa1
703
687
16
Jaguar Land Rover Automotive Plc
B1
351
347
5
RCI Banque
Baa2
190
185
4
Renault S.A.
Ba2
185
181
4
Ineos Group Holdings S.A.
B2
245
241
4
Italy , Government of
Baa3
80
77
3
Intesa Sanpaolo S.p.A .
Baa1
64
60
3
UniCredit S.p.A .
Baa1
68
65
3
Unione di Banche Italiane S.p.A .
Baa3
75
72
3
thyssenkrupp AG
B1
246
243
3
CDS Spread Decreases
Issuer
Senior Ratings
Apr. 28
Apr. 21
Spread Diff
Vedanta Resources Limited
Caa1
807
907
-100
Bayerische Landesbank
Aa3
31
66
-35
National Bank of Greece S.A.
Caa1
189
213
-24
TUI AG
Caa1
872
893
-21
CMA CGM S.A.
B3
383
403
-20
Severn Trent Plc
Baa2
54
72
-18
Novafives S.A.S.
Caa2
752
769
-17
Casino Guichard-Perrachon SA
Caa1
512
524
-12
Schaeffler Finance B.V.
Ba2
41
53
-11
Premier Foods Finance plc
B3
208
218
-10
Source: Moody's, CMA
CDS Spreads
CDS Implied Ratings
CDS Implied Ratings
CDS Spreads
3 29 April 2021
Cross-Sector: Market Data Highlights
MOODY'S ANALYTICS
CROSS-SECTOR
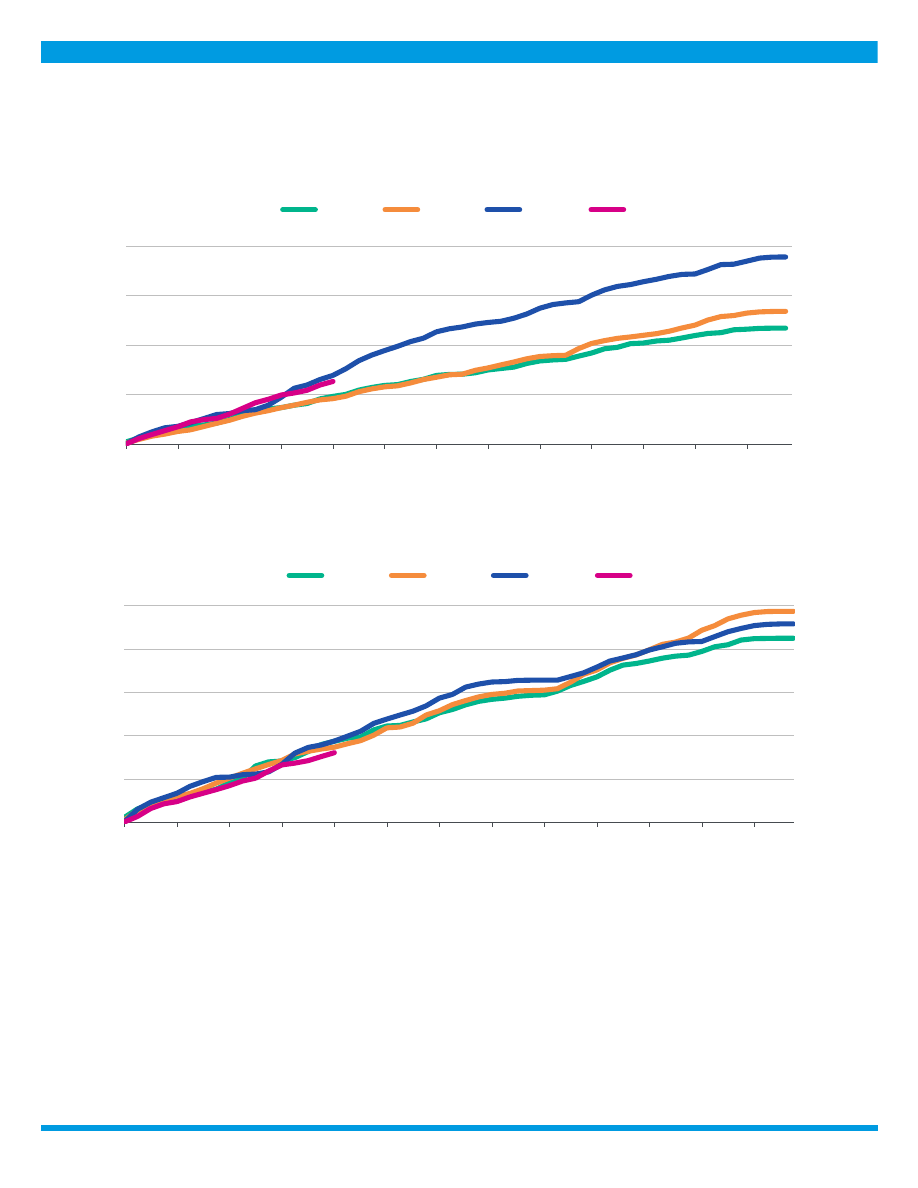
ISSUANCE
0
700
1,400
2,100
2,800
0
700
1,400
2,100
2,800
Jan Feb Mar
Apr
May
Jun
Jul
Aug
Sep
Oct
Nov
Dec
Issuance ($B)
Issuance ($B)
2018
2019
2020
2021
Source:
Moody's / Dealogic
Figure 5. Market Cumulative Issuance - Corporate & Financial Institutions: USD Denominated
0
200
400
600
800
1,000
0
200
400
600
800
1,000
Jan Feb Mar
Apr
May
Jun
Jul
Aug
Sep
Oct
Nov
Dec
Issuance ($B)
Issuance ($B)
2018
2019
2020
2021
Source:
Moody's / Dealogic
Figure 6. Market Cumulative Issuance - Corporate & Financial Institutions: Euro Denominated
4 29 April 2021
Cross-Sector: Market Data Highlights

MOODY'S ANALYTICS
CROSS-SECTOR
Investment-Grade
High-Yield
Total*
Amount
Amount
Amount
$B
$B
$B
Weekly
37.775
11.282
49.175
Year-to-Date
612.427
253.227
885.546
Investment-Grade
High-Yield
Total*
Amount
Amount
Amount
$B
$B
$B
Weekly
14.707
3.454
18.160
Year-to-Date
254.201
56.182
320.251
* Difference represents issuance with pending ratings.
Source: Moody's/ Dealogic
USD Denominated
Euro Denominated
Figure 7. Issuance: Corporate & Financial Institutions
EMERGING MARKET CREDIT SPREADS
Emerging Market
Duration
A
Baa
Ba
B
A
Baa
Ba
B
>=1 and <3
63
108
275
430
65
136
50
42
>=3 and <5
84
119
280
516
68
119
57
51
>=5 and <7
91
156
310
544
45
92
29
21
>=7
118
209
367
568
126
220
57
40
Emerging Market Sovereign
Duration
A
Baa
Ba
B
A
Baa
Ba
B
>=1 and <3
40
58
114
422
14
31
13
20
>=3 and <5
43
82
193
496
17
37
24
29
>=5 and <7
78
117
272
546
19
31
20
20
>=7
70
192
336
568
82
116
45
39
Emerging Market Corporate
Duration
A
Baa
Ba
B
A
Baa
Ba
B
>=1 and <3
67
124
305
437
51
105
37
22
>=3 and <5
90
150
341
556
51
82
33
22
>=5 and <7
116
192
382
273
26
61
9
1
>=7
140
228
529
627
44
104
12
1
Source: Moody's
Median Spreads
Bond Counts
Median Spreads
Bond Counts
Figure 8. Emerging Market Median OAS
Bond Counts
Median Spreads
5 29 April 2021
Cross-Sector: Market Data Highlights
MOODY'S ANALYTICS
CROSS-SECTOR
0
600
1,200
1,800
2,400
0
600
1,200
1,800
2,400
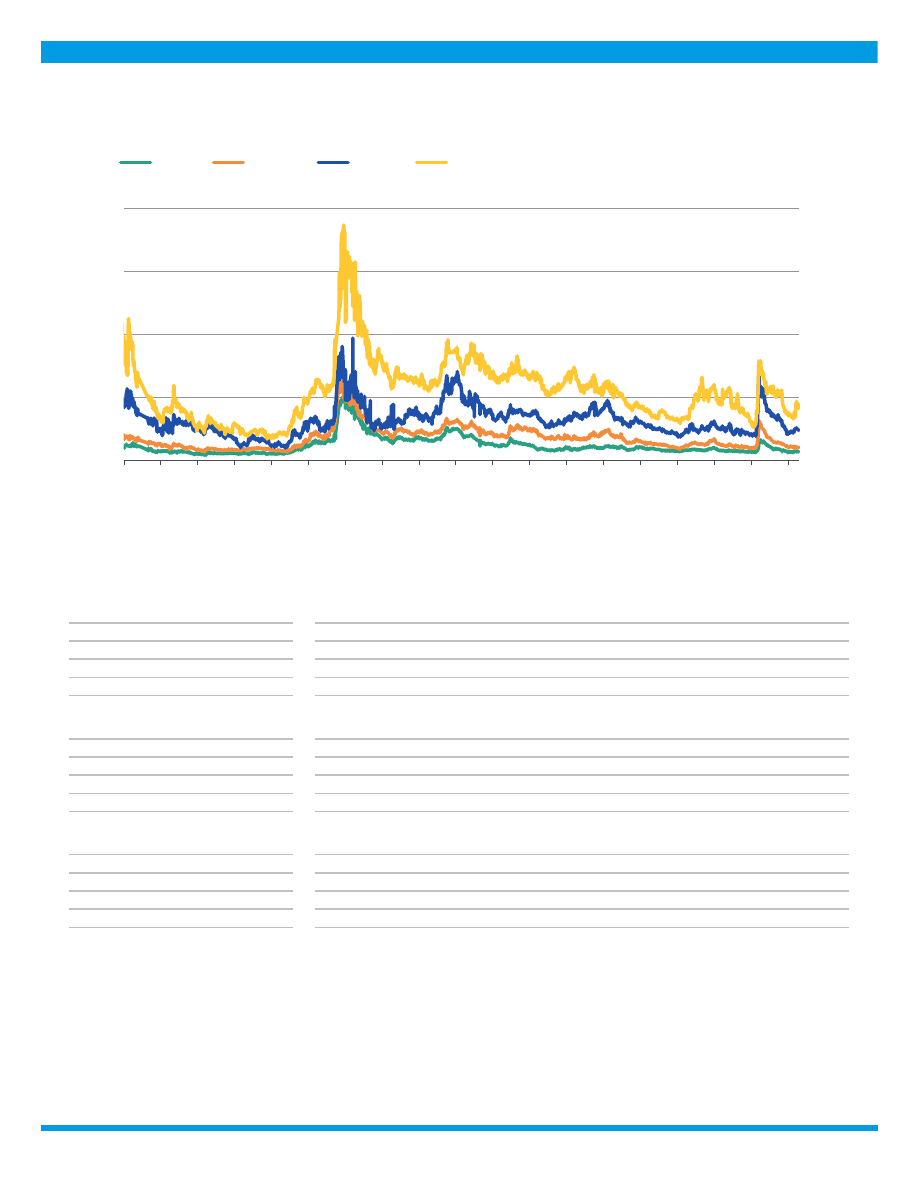
2003 2004 2005 2006 2007 2008 2009 2010 2011 2012 2013 2014 2015 2016 2017 2018 2019 2020 2021
Spread (bp)
Spread (bp)
A
Baa
Ba
B
Source: Moody's
Figure 9: Emerging Markets Median Credit Spreads (3-5 year duration)
MEDIAN CREDIT SPREADS
Duration
Aaa
Aa
A
Baa
Ba
B
Caa
>=1 and <3
4
25
41
71
197
442
526
>=3 and <5
8
30
55
102
247
557
489
>=5 and <7
19
27
66
132
289
354
-
>=7
22
35
98
151
225
396
393
Duration
Aaa
Aa
A
Baa
Ba
B
Caa
>=1 and <3
304
271
428
260
74
20
5
>=3 and <5
182
196
352
273
65
17
5
>=5 and <7
112
130
202
124
19
4
-
>=7
133
293
408
207
15
1
2
Duration
Aaa
Aa
A
Baa
Ba
B
Caa
>=1 and <3
25
85
175
153
47
19
5
>=3 and <5
30
76
146
156
41
16
5
>=5 and <7
25
62
99
79
15
4
-
>=7
32
88
151
111
11
1
1
Source: Moody's
Figure 10. Global Financial Institutions Median Credit Spreads
Median Spreads
Debt Counts
Issuer Counts
6 29 April 2021
Cross-Sector: Market Data Highlights

MOODY'S ANALYTICS
CROSS-SECTOR
Duration
Aaa
Aa
A
Baa
Ba
B
Caa
>=1 and <3
16
31
39
57
256
403
562
>=3 and <5
18
36
47
74
269
402
548
>=5 and <7
29
52
64
99
276
350
540
>=7
40
96
111
150
295
411
557
Duration
Aaa
Aa
A
Baa
Ba
B
Caa
>=1 and <3
32
120
480
833
295
227
49
>=3 and <5
35
126
485
955
295
214
77
>=5 and <7
23
88
384
775
192
110
22
>=7
42
286
1344
1932
218
44
6
Duration
Aaa
Aa
A
Baa
Ba
B
Caa
>=1 and <3
10
53
253
495
215
181
44
>=3 and <5
9
54
272
553
193
178
67
>=5 and <7
10
39
216
464
134
94
22
>=7
7
53
343
605
101
27
5
Source: Moody's
Issuer Counts
Figure 11. Global Corporate Median Credit Spreads
Median Spreads
Debt Counts
MEDIAN 5-YEAR CDS SPREADS
Global Median Spreads by Fine Rating Category
Aaa
Aa1
Aa2
Aa3
A1
A2
A3
Baa1
Baa2
13
17
21
26
32
41
45
51
57
Baa3
Ba1
Ba2
Ba3
B1
B2
B3
Caa
81
115
163
206
261
330
352
548
Global Median Spreads by Broad Rating Category
Aaa
Aa
A
Baa
Ba
B
Caa
19
39
41
57
163
330
401
Global Issuer Counts by Broad Rating Category
Aaa
Aa
A
Baa
Ba
B
Caa
9
53
168
344
100
44
30
Source: Moody's, CMA
Figure 12. Global Median CDS Spreads By Rating Category
7 29 April 2021
Cross-Sector: Market Data Highlights

MOODY'S ANALYTICS
CROSS-SECTOR
Region
Aaa
Aa
A
Baa
Ba
B
Caa
North America
19
36
40
64
162
287
379
Europe
9
29
39
55
137
240
515
Asia Pacific (ex.Japan)
16
23
41
68
125
335
-
Japan
-
-
23
29
52
72
-
Region
Aaa
Aa
A
Baa
Ba
B
Caa
North America
3
20
84
209
61
31
14
Europe
6
33
80
123
28
10
14
Asia Pacific (ex.Japan)
3
18
31
35
5
2
-
Japan
-
-
32
15
3
1
-
Source: Moody's, CMA
Issuer Counts
Figure 13. Median CDS Spreads By Region
Median CDS Spreads
Sector
Aaa
Aa
A
Baa
Ba
B
Caa
Corporates
22
33
37
60
156
279
547
Financials
10
29
40
62
154
362
192
Sovereigns
10
11
41
53
101
362
-
Banks
-
30
42
66
201
-
192
Sector
Aaa
Aa
A
Baa
Ba
B
Caa
Corporates
4
24
147
328
89
46
25
Financials
8
47
84
66
19
1
5
Banks
-
35
53
28
10
-
5
Sovereigns
8
6
4
6
3
1
-
Source: Moody's, CMA
Figure 14. Global Median CDS Spreads by Sector
Median CDS Spreads
Issuer Counts
8 29 April 2021
Cross-Sector: Market Data Highlights

MOODY'S ANALYTICS
CROSS-SECTOR
Region
Aaa
Aa
A
Baa
Ba
B
Caa
North America
10
42
43
66
187
-
-
Europe
9
30
43
62
128
-
192
Asia Pacific (ex.Japan)
16
23
42
67
104
362
-
Japan
-
-
26
45
-
-
-
Region
Aaa
Aa
A
Baa
Ba
B
Caa
North America
1
8
22
24
7
-
-
Europe
5
26
38
26
6
-
5
Asia Pacific (ex.Japan)
2
13
13
12
3
1
-
Japan
-
-
11
2
-
-
-
Source: Moody's, CMA
Figure 15. Global Financial Institutions Median CDS Spreads by Region
Median CDS Spreads
Issuer Counts
Region
Aaa
Aa
A
Baa
Ba
B
Caa
North America
22
35
39
63
159
287
379
Europe
10
26
36
52
137
240
616
Asia Pacific (ex.Japan)
32
26
41
68
144
308
-
Japan
-
-
22
28
52
72
-
Region
Aaa
Aa
A
Baa
Ba
B
Caa
North America
2
12
62
185
54
31
14
Europe
1
7
42
97
22
10
9
Asia Pacific (ex.Japan)
1
5
18
23
2
1
-
Japan
-
-
21
13
3
1
-
Source: Moody's, CMA
Median CDS Spreads
Issuer Counts
Figure 16. Global Corporates Median CDS Spreads by Region
9 29 April 2021
Cross-Sector: Market Data Highlights

MOODY'S ANALYTICS
CROSS-SECTOR
© 2021 Moody’s Corporation, Moody’s Investors Service, Inc. , Moody’s Analytics, Inc. and/or their licensors and affiliates (collectively, “MOODY’S”). All rights reserved.
CREDIT RATINGS ISSUED BY MOODY'S CREDIT RATINGS AFFILIATES ARE THEIR CURRENT OPINIONS OF THE RELATIVE FUTURE CREDIT RISK OF ENTITIES, CREDIT
COMMITMENTS, OR DEBT OR DEBT-LIKE SECURITIES, AND MATERIALS, PRODUCTS, SERVICES AND INFORMATION PUBLISHED BY MOODY’S (COLLECTIVELY,
“PUBLICATIONS”) MAY INCLUDE SUCH CURRENT OPINIONS. MOODY’S DEFINES CREDIT RISK AS THE RISK THAT AN ENTITY MAY NOT MEET ITS CONTRACTUAL
FINANCIAL OBLIGATIONS AS THEY COME DUE AND ANY ESTIMATED FINANCIAL LOSS IN THE EVENT OF DEFAULT OR IMPAIRMENT. SEE APPLICABLE MOODY’S
RATING SYMBOLS AND DEFINITIONS PUBLICATION FOR INFORMATION ON THE TYPES OF CONTRACTUAL FINANCIAL OBLIGATIONS ADDRESSED BY MOODY’S
CREDIT RATINGS. CREDIT RATINGS DO NOT ADDRESS ANY OTHER RISK, INCLUDING BUT NOT LIMITED TO: LIQUIDITY RISK, MARKET VALUE RISK, OR PRICE
VOLATILITY. CREDIT RATINGS, NON-CREDIT ASSESSMENTS (“ASSESSMENTS”), AND OTHER OPINIONS INCLUDED IN MOODY’S PUBLICATIONS ARE NOT
STATEMENTS OF CURRENT OR HISTORICAL FACT. MOODY’S PUBLICATIONS MAY ALSO INCLUDE QUANTITATIVE MODEL-BASED ESTIMATES OF CREDIT RISK AND
RELATED OPINIONS OR COMMENTARY PUBLISHED BY MOODY’S ANALYTICS, INC. AND/OR ITS AFFILIATES. MOODY’S CREDIT RATINGS, ASSESSMENTS, OTHER
OPINIONS AND PUBLICATIONS DO NOT CONSTITUTE OR PROVIDE INVESTMENT OR FINANCIAL ADVICE, AND MOODY’S CREDIT RATINGS, ASSESSMENTS, OTHER
OPINIONS AND PUBLICATIONS ARE NOT AND DO NOT PROVIDE RECOMMENDATIONS TO PURCHASE, SELL, OR HOLD PARTICULAR SECURITIES. MOODY’S CREDIT
RATINGS, ASSESSMENTS, OTHER OPINIONS AND PUBLICATIONS DO NOT COMMENT ON THE SUITABILITY OF AN INVESTMENT FOR ANY PARTICULAR INVESTOR.
MOODY’S ISSUES ITS CREDIT RATINGS, ASSESSMENTS AND OTHER OPINIONS AND PUBLISHES ITS PUBLICATIONS WITH THE EXPECTATION AND UNDERSTANDING
THAT EACH INVESTOR WILL, WITH DUE CARE, MAKE ITS OWN STUDY AND EVALUATION OF EACH SECURITY THAT IS UNDER CONSIDERATION FOR PURCHASE,
HOLDING, OR SALE.
MOODY’S CREDIT RATINGS, ASSESSMENTS, OTHER OPINIONS, AND PUBLICATIONS ARE NOT INTENDED FOR USE BY RETAIL INVESTORS AND IT WOULD BE RECKLESS
AND INAPPROPRIATE FOR RETAIL INVESTORS TO USE MOODY’S CREDIT RATINGS, ASSESSMENTS, OTHER OPINIONS OR PUBLICATIONS WHEN MAKING AN INVESTMENT
DECISION. IF IN DOUBT YOU SHOULD CONTACT YOUR FINANCIAL OR OTHER PROFESSIONAL ADVISER.
ALL INFORMATION CONTAINED HEREIN IS PROTECTED BY LAW, INCLUDING BUT NOT LIMITED TO, COPYRIGHT LAW, AND NONE OF SUCH INFORMATION MAY BE COPIED
OR OTHERWISE REPRODUCED, REPACKAGED, FURTHER TRANSMITTED, TRANSFERRED, DISSEMINATED, REDISTRIBUTED OR RESOLD, OR STORED FOR SUBSEQUENT USE
FOR ANY SUCH PURPOSE, IN WHOLE OR IN PART, IN ANY FORM OR MANNER OR BY ANY MEANS WHATSOEVER, BY ANY PERSON WITHOUT MOODY’S PRIOR WRITTEN
CONSENT.
MOODY’S CREDIT RATINGS, ASSESSMENTS, OTHER OPINIONS AND PUBLICATIONS ARE NOT INTENDED FOR USE BY ANY PERSON AS A BENCHMARK AS THAT TERM IS
DEFINED FOR REGULATORY PURPOSES AND MUST NOT BE USED IN ANY WAY THAT COULD RESULT IN THEM BEING CONSIDERED A BENCHMARK.
All information contained herein is obtained by MOODY’S from sources believed by it to be accurate and reliable. Because of the possibility of human or mechanical error as well
as other factors, however, all information contained herein is provided “AS IS” without warranty of any kind. MOODY'S adopts all necessary measures so that the information it
uses in assigning a credit rating is of sufficient quality and from sources MOODY'S considers to be reliable including, when appropriate, independent third-party sources. However,
MOODY’S is not an auditor and cannot in every instance independently verify or validate information received in the rating process or in preparing its Publications.
To the extent permitted by law, MOODY’S and its directors, officers, employees, agents, representatives, licensors and suppliers disclaim liability to any person or entity for any
indirect, special, consequential, or incidental losses or damages whatsoever arising from or in connection with the information contained herein or the use of or inability to use any
such information, even if MOODY’S or any of its directors, officers, employees, agents, representatives, licensors or suppliers is advised in advance of the possibility of such losses or
damages, including but not limited to: (a) any loss of present or prospective profits or (b) any loss or damage arising where the relevant financial instrument is not the subject of a
particular credit rating assigned by MOODY’S.
To the extent permitted by law, MOODY’S and its directors, officers, employees, agents, representatives, licensors and suppliers disclaim liability for any direct or compensatory
losses or damages caused to any person or entity, including but not limited to by any negligence (but excluding fraud, willful misconduct or any other type of liability that, for the
avoidance of doubt, by law cannot be excluded) on the part of, or any contingency within or beyond the control of, MOODY’S or any of its directors, officers, employees, agents,
representatives, licensors or suppliers, arising from or in connection with the information contained herein or the use of or inability to use any such information.
NO WARRANTY, EXPRESS OR IMPLIED, AS TO THE ACCURACY, TIMELINESS, COMPLETENESS, MERCHANTABILITY OR FITNESS FOR ANY PARTICULAR PURPOSE OF ANY CREDIT
RATING, ASSESSMENT, OTHER OPINION OR INFORMATION IS GIVEN OR MADE BY MOODY’S IN ANY FORM OR MANNER WHATSOEVER.
Moody’s Investors Service, Inc. , a wholly-owned credit rating agency subsidiary of Moody’s Corporation (“MCO”), hereby discloses that most issuers of debt securities (including
corporate and municipal bonds, debentures, notes and commercial paper) and preferred stock rated by Moody’s Investors Service, Inc. have, prior to assignment of any credit rating,
agreed to pay to Moody’s Investors Service, Inc. for credit ratings opinions and services rendered by it fees ranging from $1,000 to approximately $5,000,000 . MCO and Moody’s
Investors Service also maintain policies and procedures to address the independence of Moody’s Investors Service credit ratings and credit rating processes. Information regarding
certain affiliations that may exist between directors of MCO and rated entities, and between entities who hold credit ratings from Moody’s Investors Service and have also publicly
reported to the SEC an ownership interest in MCO of more than 5%, is posted annually at
under the heading “Investor Relations — Corporate Governance —
Director and Shareholder Affiliation Policy.”
Additional terms for Australia only: Any publication into Australia of this document is pursuant to the Australian Financial Services License of MOODY’S affiliate, Moody’s Investors
Service Pty Limited ABN 61 003 399 657AFSL 336969 and/or Moody’s Analytics Australia Pty Ltd ABN 94 105 136 972 AFSL 383569 (as applicable). This document is intended
to be provided only to “wholesale clients” within the meaning of section 761G of the Corporations Act 2001. By continuing to access this document from within Australia , you
represent to MOODY’S that you are, or are accessing the document as a representative of, a “wholesale client” and that neither you nor the entity you represent will directly or
indirectly disseminate this document or its contents to “retail clients” within the meaning of section 761G of the Corporations Act 2001. MOODY’S credit rating is an opinion as to
the creditworthiness of a debt obligation of the issuer, not on the equity securities of the issuer or any form of security that is available to retail investors.
Additional terms for Japan only: Moody's Japan K.K. (“MJKK”) is a wholly-owned credit rating agency subsidiary of Moody's Group Japan G.K., which is wholly-owned by Moody’s
Overseas Holdings Inc. , a wholly-owned subsidiary of MCO. Moody’s SF Japan K.K. (“MSFJ”) is a wholly-owned credit rating agency subsidiary of MJKK. MSFJ is not a Nationally
Recognized Statistical Rating Organization (“NRSRO”). Therefore, credit ratings assigned by MSFJ are Non-NRSRO Credit Ratings. Non-NRSRO Credit Ratings are assigned by an
entity that is not a NRSRO and, consequently, the rated obligation will not qualify for certain types of treatment under U.S. laws. MJKK and MSFJ are credit rating agencies registered
with the Japan Financial Services Agency and their registration numbers are FSA Commissioner (Ratings) No. 2 and 3 respectively.
MJKK or MSFJ (as applicable) hereby disclose that most issuers of debt securities (including corporate and municipal bonds, debentures, notes and commercial paper) and preferred
stock rated by MJKK or MSFJ (as applicable) have, prior to assignment of any credit rating, agreed to pay to MJKK or MSFJ (as applicable) for credit ratings opinions and services
rendered by it fees ranging from JPY125,000 to approximately JPY550,000,000 .
MJKK and MSFJ also maintain policies and procedures to address Japanese regulatory requirements.
REPORT NUMBER
1281345
10 29 April 2021
Cross-Sector: Market Data Highlights

MOODY'S ANALYTICS
CROSS-SECTOR
CLIENT SERVICES
Americas
1-212-553-1653
Asia Pacific
852-3551-3077
Japan
81-3-5408-4100
EMEA
44-20-7772-5454
11 29 April 2021
Cross-Sector: Market Data Highlights
