Cross-Sector: Market Data Highlights

CROSS-SECTOR
DATA REPORT
9 December 2021
CLIENT SERVICES
Americas
1-212-553-1653
Asia Pacific
852-3551-3077
Japan
81-3-5408-4100
EMEA
44-20-7772-5454
Cross-Sector
Market Data Highlights
The latest market data from Weekly Market Outlook. Click
for access to the full WMO.
SPREADS
0
200
400
600
800
0
200
400
600
800
2003 2004 2005 2006 2007 2008 2009 2010 2011 2012 2013 2014 2015 2016 2017 2018 2019 2020 2021
Spread (bp)
Spread (bp)
Aa2
A2
Baa2
Source: Moody's
Figure 1: 5-Year Median Spreads-Global Data (High Grade)
0
400
800
1,200
1,600
2,000
0
400
800
1,200
1,600
2,000
2003 2004 2005 2006 2007 2008 2009 2010 2011 2012 2013 2014 2015 2016 2017 2018 2019 2020 2021
Spread (bp)
Spread (bp)
Ba2
B2
Caa-C
Source: Moody's
Figure 2: 5-Year Median Spreads-Global Data (High Yield)
Moody’s Analytics markets and distributes all Moody’s Capital Markets Research, Inc. materials. Moody’s Capital Markets
Research,Inc. is a subsidiary of Moody’s Corporation. Moody’s Analytics does not provide investment advisory services or
products. For further detail, please see the last page.
MOODY'S ANALYTICS
CROSS-SECTOR
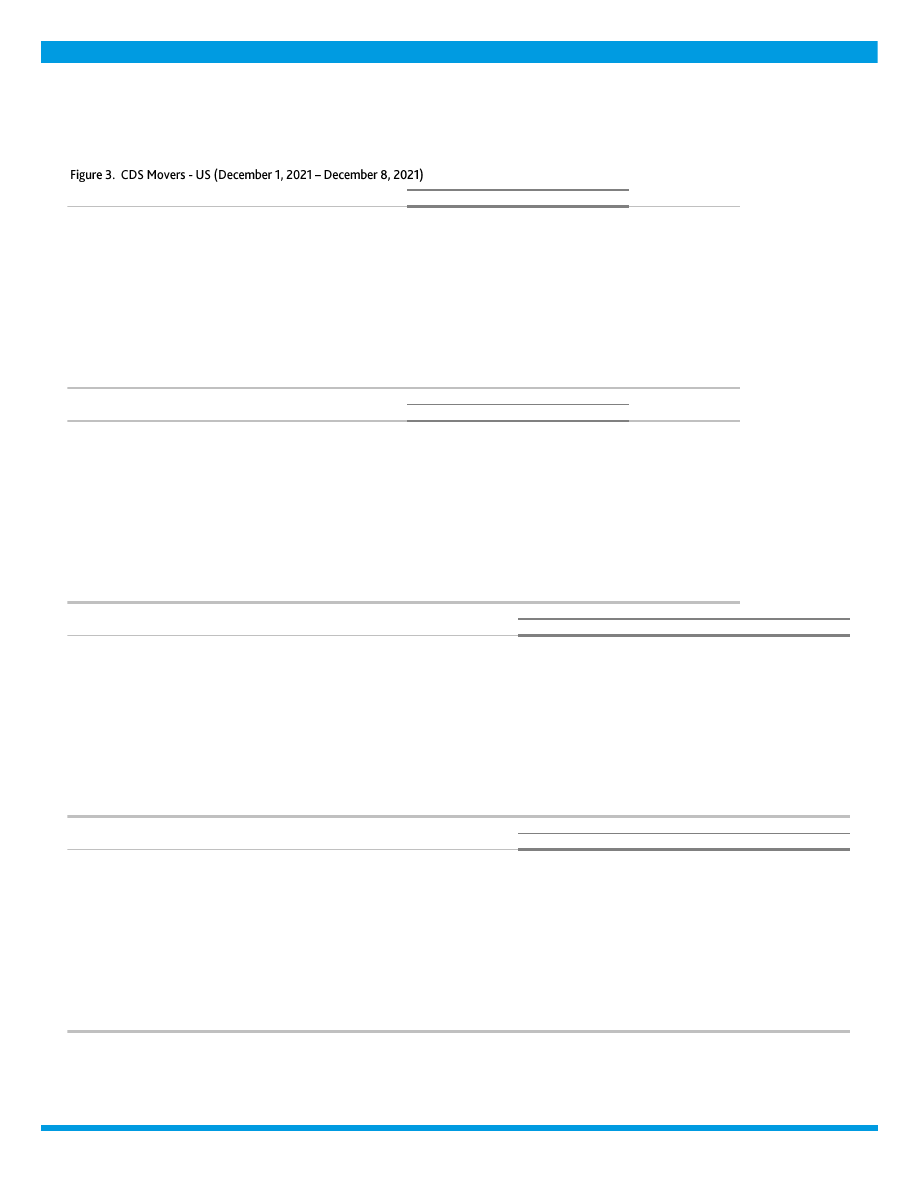
CDS MOVERS
CDS Implied Rating Rises
Issuer
Dec. 8
Dec. 1
Senior Ratings
ConocoPhillips
A2
Baa1
A3
Ralph Lauren Corporation
Aa2
A1
A3
Burlington Resources LLC
Aa3
A2
A3
Wells Fargo & Company
Baa1
Baa2
A1
Bank of America Corporation
Baa1
Baa2
A2
Ford Motor Credit Company LLC
Ba1
Ba2
Ba2
CVS Health Corporation
A2
A3
Baa2
International Business Machines Corporation
A2
A3
A3
3M Company
Aa3
A1
A1
Merck & Co., Inc.
Aa3
A1
A1
CDS Implied Rating Declines
Issuer
Dec. 8
Dec. 1
Senior Ratings
CenterPoint Energy, Inc.
Baa2
A3
Baa2
PepsiCo, Inc.
A2
A1
A1
Philip Morris International Inc.
A2
A1
A2
General Electric Company
Baa3
Baa2
Baa1
Eli Lilly and Company
Aa2
Aa1
A2
FirstEnergy Corp.
Baa3
Baa2
Ba1
Emerson Electric Company
Baa1
A3
A2
Danaher Corporation
A3
A2
Baa1
Archer-Daniels-Midland Company
A2
A1
A2
United Rentals ( North America ), Inc.
Ba2
Ba1
Ba2
CDS Spread Increases
Issuer
Senior Ratings
Dec. 8
Dec. 1
Spread Diff
Talen Energy Supply, LLC
Caa1
2,909
1,842
1,068
CenterPoint Energy, Inc.
Baa2
56
49
7
Corning Incorporated
Baa1
87
81
7
Emerson Electric Company
A2
53
49
5
Xcel Energy Inc.
Baa1
58
53
5
Owens Corning
Baa3
68
63
5
American Tower Corporation
Baa3
84
80
4
FirstEnergy Corp.
Ba1
75
72
3
Federal Realty Investment Trust
Baa1
55
51
3
Agilent Technologies, Inc.
Baa2
64
61
3
CDS Spread Decreases
Issuer
Senior Ratings
Dec. 8
Dec. 1
Spread Diff
Nabors Industries , Inc.
Caa2
748
872
-124
American Airlines Group Inc.
Caa1
739
852
-114
Staples, Inc.
Caa1
1,106
1,156
-50
Delta Air Lines, Inc.
Baa3
233
274
-41
Carnival Corporation
B2
469
508
-39
United Airlines Holdings, Inc.
Ba3
407
444
-37
United States Steel Corporation
B3
346
382
-36
NRG Energy, Inc.
Ba2
206
241
-35
Xerox Corporation
Ba1
235
268
-33
Service Properties Trust
Ba2
255
286
-31
Source: Moody's, CMA
CDS Spreads
CDS Implied Ratings
CDS Implied Ratings
CDS Spreads
2 9 December 2021
Cross-Sector: Market Data Highlights
MOODY'S ANALYTICS
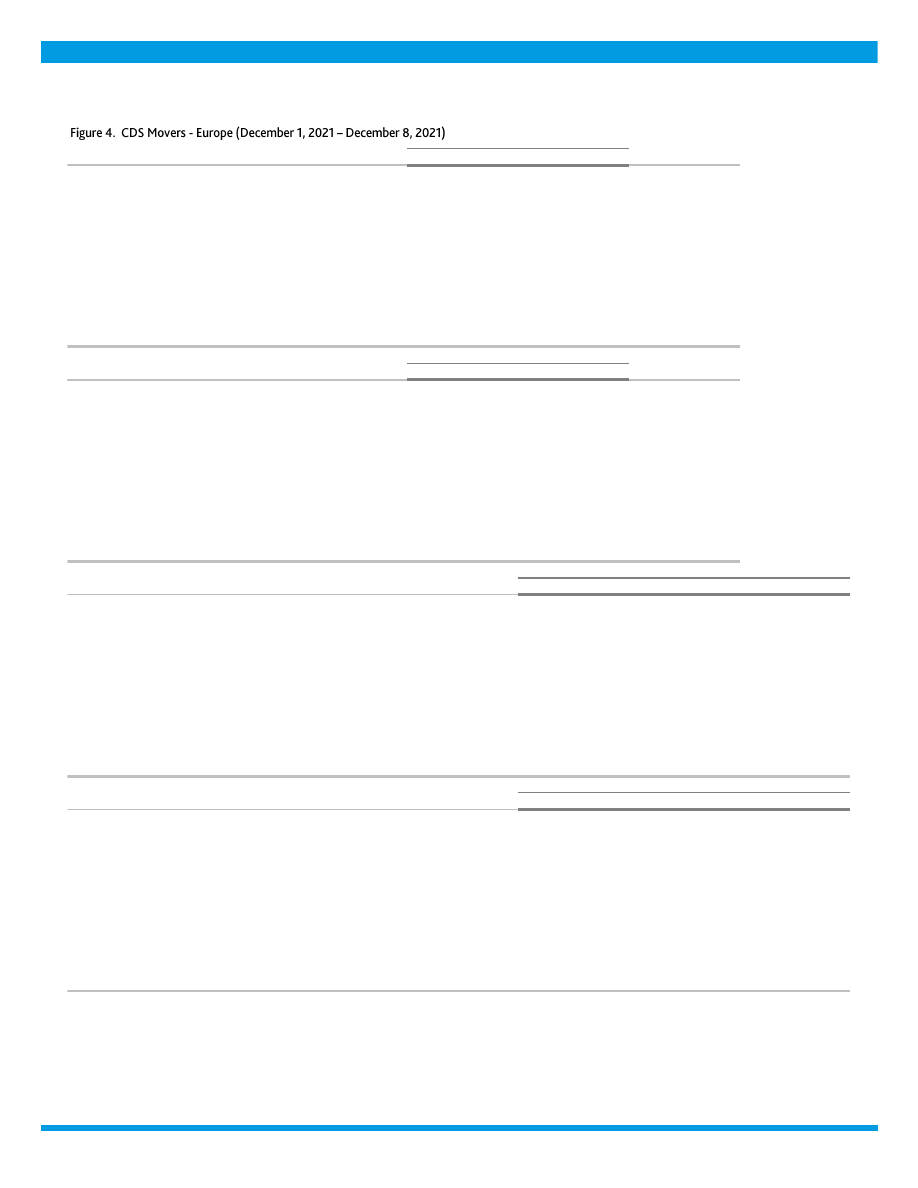
CROSS-SECTOR
CDS Implied Rating Rises
Issuer
Dec. 8
Dec. 1
Senior Ratings
UniCredit S.p.A .
Baa2
Baa3
Baa1
Erste Group Bank AG
A1
A2
A2
Standard Chartered Bank
A1
A2
A1
BNP Paribas Fortis SA/NV
Aa3
A1
A2
KBC Bank N.V.
Aa3
A1
A1
RWE AG
A1
A2
Baa2
BAE SYSTEMS plc
A3
Baa1
Baa2
Investor AB
A2
A3
Aa3
Stora Enso Oyj
Baa2
Baa3
Baa3
Telekom Austria AG
A2
A3
Baa1
CDS Implied Rating Declines
Issuer
Dec. 8
Dec. 1
Senior Ratings
Orsted A/S
A1
Aa2
Baa1
Spain , Government of
Aa3
Aa2
Baa1
CaixaBank, S.A.
Baa1
A3
Baa1
Lloyds Bank plc
A1
Aa3
A1
Svenska Handelsbanken AB
Aa2
Aa1
Aa2
TotalEnergies SE
Aa3
Aa2
A1
Daimler AG
Baa1
A3
A3
Deutsche Telekom AG
A2
A1
Baa1
Landesbank Hessen-Thueringen GZ
A2
A1
Aa3
Banco Comercial Portugues, S.A.
Ba3
Ba2
Ba1
CDS Spread Increases
Issuer
Senior Ratings
Dec. 8
Dec. 1
Spread Diff
thyssenkrupp AG
B1
210
190
20
Banca Monte dei Paschi di Siena S.p.A .
Caa1
249
239
11
CECONOMY AG
Ba1
209
200
9
Orsted A/S
Baa1
36
29
7
Greece , Government of
Ba3
115
111
4
Landesbank Hessen-Thueringen GZ
Aa3
42
37
4
Norddeutsche Landesbank GZ
A3
69
67
3
ASML Holding N.V.
A2
42
39
3
Marks & Spencer p.l.c.
Ba1
170
168
3
Hammerson Plc
Baa3
186
182
3
CDS Spread Decreases
Issuer
Senior Ratings
Dec. 8
Dec. 1
Spread Diff
Vedanta Resources Limited
B3
694
832
-138
Casino Guichard-Perrachon SA
Caa1
616
678
-62
Boparan Finance plc
Caa1
1,258
1,298
-40
Novafives S.A.S.
Caa2
602
637
-34
Iceland Bondco plc
Caa2
570
602
-32
Premier Foods Finance plc
B3
216
248
-32
Deutsche Lufthansa Aktiengesellschaft
Ba2
263
294
-30
Vue International Bidco plc
Ca
597
618
-21
Unibail-Rodamco-Westfield SE
Baa2
119
138
-20
Piraeus Financial Holdings S.A.
Caa2
595
614
-18
Source: Moody's, CMA
CDS Spreads
CDS Implied Ratings
CDS Implied Ratings
CDS Spreads
3 9 December 2021
Cross-Sector: Market Data Highlights
MOODY'S ANALYTICS
CROSS-SECTOR
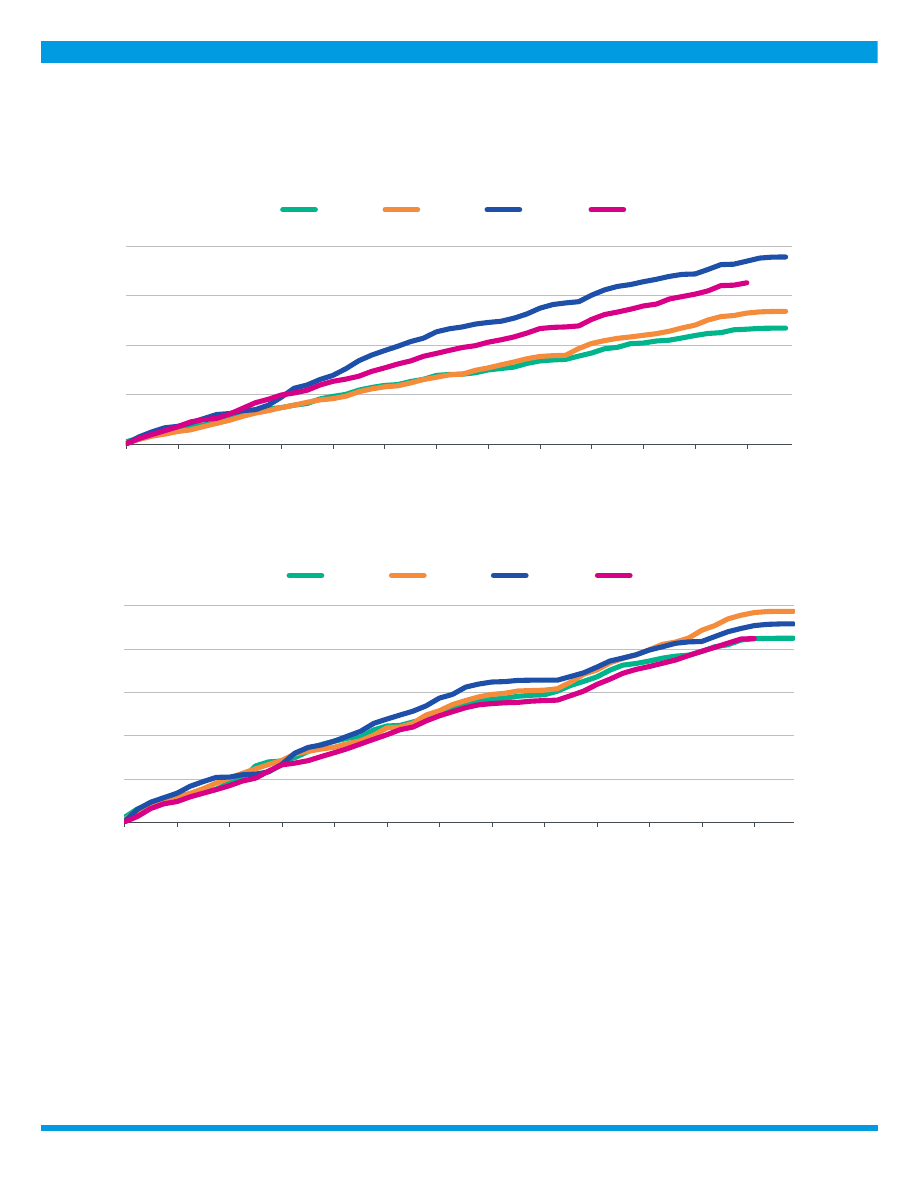
ISSUANCE
0
700
1,400
2,100
2,800
0
700
1,400
2,100
2,800
Jan Feb Mar
Apr
May
Jun
Jul
Aug
Sep
Oct
Nov
Dec
Issuance ($B)
Issuance ($B)
2018
2019
2020
2021
Source:
Moody's / Dealogic
Figure 5. Market Cumulative Issuance - Corporate & Financial Institutions: USD Denominated
0
200
400
600
800
1,000
0
200
400
600
800
1,000
Jan Feb Mar
Apr
May
Jun
Jul
Aug
Sep
Oct
Nov
Dec
Issuance ($B)
Issuance ($B)
2018
2019
2020
2021
Source:
Moody's / Dealogic
Figure 6. Market Cumulative Issuance - Corporate & Financial Institutions: Euro Denominated
4 9 December 2021
Cross-Sector: Market Data Highlights

MOODY'S ANALYTICS
CROSS-SECTOR
Investment-Grade
High-Yield
Total*
Amount
Amount
Amount
$B
$B
$B
Weekly
29.904
1.450
33.286
Year-to-Date
1,602.218
609.161
2,281.953
Investment-Grade
High-Yield
Total*
Amount
Amount
Amount
$B
$B
$B
Weekly
1.910
0.000
1.910
Year-to-Date
671.172
155.616
848.068
* Difference represents issuance with pending ratings.
Source: Moody's/ Dealogic
USD Denominated
Euro Denominated
Figure 7. Issuance: Corporate & Financial Institutions
EMERGING MARKET CREDIT SPREADS
Emerging Market
Duration
A
Baa
Ba
B
A
Baa
Ba
B
>=1 and <3
61
96
252
512
64
157
48
42
>=3 and <5
63
114
293
580
94
132
53
51
>=5 and <7
68
153
307
626
47
94
30
24
>=7
104
211
403
648
121
249
57
32
Emerging Market Sovereign
Duration
A
Baa
Ba
B
A
Baa
Ba
B
>=1 and <3
50
63
81
491
16
40
17
19
>=3 and <5
36
92
208
576
23
40
23
26
>=5 and <7
32
102
294
633
20
29
17
19
>=7
66
192
396
648
73
131
43
31
Emerging Market Corporate
Duration
A
Baa
Ba
B
A
Baa
Ba
B
>=1 and <3
69
109
296
551
48
117
31
23
>=3 and <5
71
133
335
600
71
92
30
25
>=5 and <7
84
173
326
562
27
65
13
5
>=7
142
247
438
664
48
118
14
1
Source: Moody's
Median Spreads
Bond Counts
Median Spreads
Bond Counts
Figure 8. Emerging Market Median OAS
Bond Counts
Median Spreads
5 9 December 2021
Cross-Sector: Market Data Highlights

MOODY'S ANALYTICS
CROSS-SECTOR
0
600
1,200
1,800
2,400
0
600
1,200
1,800
2,400
2003 2004 2005 2006 2007 2008 2009 2010 2011 2012 2013 2014 2015 2016 2017 2018 2019 2020 2021
Spread (bp)
Spread (bp)
A
Baa
Ba
B
Source: Moody's
Figure 9: Emerging Markets Median Credit Spreads (3-5 year duration)
MEDIAN CREDIT SPREADS
Duration
Aaa
Aa
A
Baa
Ba
B
Caa
>=1 and <3
12
32
45
81
197
527
-
>=3 and <5
9
30
47
97
222
594
562
>=5 and <7
16
21
41
110
282
433
502
>=7
13
38
45
153
189
-
335
Duration
Aaa
Aa
A
Baa
Ba
B
Caa
>=1 and <3
276
293
509
327
73
17
-
>=3 and <5
205
258
490
304
62
23
3
>=5 and <7
149
152
327
157
28
10
5
>=7
148
332
722
293
16
-
3
Duration
Aaa
Aa
A
Baa
Ba
B
Caa
>=1 and <3
30
87
180
181
43
15
-
>=3 and <5
33
93
186
160
38
22
3
>=5 and <7
29
66
111
95
20
8
5
>=7
34
94
164
125
11
-
2
Source: Moody's
Figure 10. Global Financial Institutions Median Credit Spreads
Median Spreads
Debt Counts
Issuer Counts
6 9 December 2021
Cross-Sector: Market Data Highlights

MOODY'S ANALYTICS
CROSS-SECTOR
Duration
Aaa
Aa
A
Baa
Ba
B
Caa
>=1 and <3
24
37
44
68
226
397
583
>=3 and <5
28
38
47
75
251
406
544
>=5 and <7
24
48
57
95
268
363
544
>=7
78
100
113
149
271
380
370
Duration
Aaa
Aa
A
Baa
Ba
B
Caa
>=1 and <3
13
95
531
866
229
143
33
>=3 and <5
8
128
555
1031
287
256
59
>=5 and <7
7
78
423
815
222
185
54
>=7
43
259
1532
2092
185
40
2
Duration
Aaa
Aa
A
Baa
Ba
B
Caa
>=1 and <3
4
46
257
519
163
118
31
>=3 and <5
4
50
280
589
207
223
52
>=5 and <7
4
34
230
492
162
151
51
>=7
4
51
343
621
94
27
2
Source: Moody's
Issuer Counts
Figure 11. Global Corporate Median Credit Spreads
Median Spreads
Debt Counts
MEDIAN 5-YEAR CDS SPREADS
Global Median Spreads by Fine Rating Category
Aaa
Aa1
Aa2
Aa3
A1
A2
A3
Baa1
Baa2
16
22
32
34
37
39
45
51
59
Baa3
Ba1
Ba2
Ba3
B1
B2
B3
Caa
82
114
159
204
261
334
406
714
Global Median Spreads by Broad Rating Category
Aaa
Aa
A
Baa
Ba
B
Caa
23
32
39
59
159
334
599
Global Issuer Counts by Broad Rating Category
Aaa
Aa
A
Baa
Ba
B
Caa
9
49
172
345
89
44
27
Source: Moody's, CMA
Figure 12. Global Median CDS Spreads By Rating Category
7 9 December 2021
Cross-Sector: Market Data Highlights

MOODY'S ANALYTICS
CROSS-SECTOR
Region
Aaa
Aa
A
Baa
Ba
B
Caa
North America
23
32
38
59
162
276
590
Europe
9
27
38
60
151
226
583
Asia Pacific (ex.Japan)
15
29
52
76
151
297
-
Japan
-
-
22
30
47
64
-
Region
Aaa
Aa
A
Baa
Ba
B
Caa
North America
3
20
84
208
57
30
12
Europe
6
29
85
124
22
12
12
Asia Pacific (ex.Japan)
3
18
31
37
5
2
-
Japan
-
-
32
14
3
1
-
Source: Moody's, CMA
Issuer Counts
Figure 13. Median CDS Spreads By Region
Median CDS Spreads
Sector
Aaa
Aa
A
Baa
Ba
B
Caa
Corporates
23
31
34
59
166
235
609
Financials
9
29
43
65
157
360
314
Sovereigns
9
12
49
85
106
360
1461
Banks
-
31
43
67
218
265
281
Sector
Aaa
Aa
A
Baa
Ba
B
Caa
Corporates
3
24
142
320
80
44
22
Financials
9
43
93
76
17
3
5
Banks
-
32
58
30
8
1
4
Sovereigns
9
7
6
13
4
1
1
Source: Moody's, CMA
Issuer Counts
Figure 14. Global Median CDS Spreads by Sector
Median CDS Spreads
8 9 December 2021
Cross-Sector: Market Data Highlights

MOODY'S ANALYTICS
CROSS-SECTOR
Region
Aaa
Aa
A
Baa
Ba
B
Caa
North America
13
38
48
61
182
375
-
Europe
9
27
41
64
105
265
281
Asia Pacific (ex.Japan)
15
30
53
77
97
360
-
Japan
-
-
29
67
-
-
-
Region
Aaa
Aa
A
Baa
Ba
B
Caa
North America
1
7
24
24
6
1
-
Europe
6
23
43
30
4
1
4
Asia Pacific (ex.Japan)
2
13
14
13
3
1
-
Japan
-
-
11
2
-
-
-
Source: Moody's, CMA
Figure 15. Global Financial Institutions Median CDS Spreads by Region
Median CDS Spreads
Issuer Counts
Region
Aaa
Aa
A
Baa
Ba
B
Caa
North America
24
31
34
59
162
261
590
Europe
-
32
35
57
157
216
600
Asia Pacific (ex.Japan)
20
27
52
74
168
235
-
Japan
-
-
21
28
47
64
-
Region
Aaa
Aa
A
Baa
Ba
B
Caa
North America
2
13
60
184
51
29
12
Europe
-
6
42
94
18
11
8
Asia Pacific (ex.Japan)
1
5
17
24
2
1
-
Japan
-
-
21
12
3
1
-
Source: Moody's, CMA
Median CDS Spreads
Issuer Counts
Figure 16. Global Corporates Median CDS Spreads by Region
9 9 December 2021
Cross-Sector: Market Data Highlights

MOODY'S ANALYTICS
CROSS-SECTOR
© 2021 Moody’s Corporation, Moody’s Investors Service, Inc. , Moody’s Analytics, Inc. and/or their licensors and affiliates (collectively, “MOODY’S”). All rights reserved.
CREDIT RATINGS ISSUED BY MOODY'S CREDIT RATINGS AFFILIATES ARE THEIR CURRENT OPINIONS OF THE RELATIVE FUTURE CREDIT RISK OF ENTITIES, CREDIT
COMMITMENTS, OR DEBT OR DEBT-LIKE SECURITIES, AND MATERIALS, PRODUCTS, SERVICES AND INFORMATION PUBLISHED BY MOODY’S (COLLECTIVELY,
“PUBLICATIONS”) MAY INCLUDE SUCH CURRENT OPINIONS. MOODY’S DEFINES CREDIT RISK AS THE RISK THAT AN ENTITY MAY NOT MEET ITS CONTRACTUAL
FINANCIAL OBLIGATIONS AS THEY COME DUE AND ANY ESTIMATED FINANCIAL LOSS IN THE EVENT OF DEFAULT OR IMPAIRMENT. SEE APPLICABLE MOODY’S
RATING SYMBOLS AND DEFINITIONS PUBLICATION FOR INFORMATION ON THE TYPES OF CONTRACTUAL FINANCIAL OBLIGATIONS ADDRESSED BY MOODY’S
CREDIT RATINGS. CREDIT RATINGS DO NOT ADDRESS ANY OTHER RISK, INCLUDING BUT NOT LIMITED TO: LIQUIDITY RISK, MARKET VALUE RISK, OR PRICE
VOLATILITY. CREDIT RATINGS, NON-CREDIT ASSESSMENTS (“ASSESSMENTS”), AND OTHER OPINIONS INCLUDED IN MOODY’S PUBLICATIONS ARE NOT
STATEMENTS OF CURRENT OR HISTORICAL FACT. MOODY’S PUBLICATIONS MAY ALSO INCLUDE QUANTITATIVE MODEL-BASED ESTIMATES OF CREDIT RISK AND
RELATED OPINIONS OR COMMENTARY PUBLISHED BY MOODY’S ANALYTICS, INC. AND/OR ITS AFFILIATES. MOODY’S CREDIT RATINGS, ASSESSMENTS, OTHER
OPINIONS AND PUBLICATIONS DO NOT CONSTITUTE OR PROVIDE INVESTMENT OR FINANCIAL ADVICE, AND MOODY’S CREDIT RATINGS, ASSESSMENTS, OTHER
OPINIONS AND PUBLICATIONS ARE NOT AND DO NOT PROVIDE RECOMMENDATIONS TO PURCHASE, SELL, OR HOLD PARTICULAR SECURITIES. MOODY’S CREDIT
RATINGS, ASSESSMENTS, OTHER OPINIONS AND PUBLICATIONS DO NOT COMMENT ON THE SUITABILITY OF AN INVESTMENT FOR ANY PARTICULAR INVESTOR.
MOODY’S ISSUES ITS CREDIT RATINGS, ASSESSMENTS AND OTHER OPINIONS AND PUBLISHES ITS PUBLICATIONS WITH THE EXPECTATION AND UNDERSTANDING
THAT EACH INVESTOR WILL, WITH DUE CARE, MAKE ITS OWN STUDY AND EVALUATION OF EACH SECURITY THAT IS UNDER CONSIDERATION FOR PURCHASE,
HOLDING, OR SALE.
MOODY’S CREDIT RATINGS, ASSESSMENTS, OTHER OPINIONS, AND PUBLICATIONS ARE NOT INTENDED FOR USE BY RETAIL INVESTORS AND IT WOULD BE RECKLESS
AND INAPPROPRIATE FOR RETAIL INVESTORS TO USE MOODY’S CREDIT RATINGS, ASSESSMENTS, OTHER OPINIONS OR PUBLICATIONS WHEN MAKING AN INVESTMENT
DECISION. IF IN DOUBT YOU SHOULD CONTACT YOUR FINANCIAL OR OTHER PROFESSIONAL ADVISER.
ALL INFORMATION CONTAINED HEREIN IS PROTECTED BY LAW, INCLUDING BUT NOT LIMITED TO, COPYRIGHT LAW, AND NONE OF SUCH INFORMATION MAY BE COPIED
OR OTHERWISE REPRODUCED, REPACKAGED, FURTHER TRANSMITTED, TRANSFERRED, DISSEMINATED, REDISTRIBUTED OR RESOLD, OR STORED FOR SUBSEQUENT USE
FOR ANY SUCH PURPOSE, IN WHOLE OR IN PART, IN ANY FORM OR MANNER OR BY ANY MEANS WHATSOEVER, BY ANY PERSON WITHOUT MOODY’S PRIOR WRITTEN
CONSENT.
MOODY’S CREDIT RATINGS, ASSESSMENTS, OTHER OPINIONS AND PUBLICATIONS ARE NOT INTENDED FOR USE BY ANY PERSON AS A BENCHMARK AS THAT TERM IS
DEFINED FOR REGULATORY PURPOSES AND MUST NOT BE USED IN ANY WAY THAT COULD RESULT IN THEM BEING CONSIDERED A BENCHMARK.
All information contained herein is obtained by MOODY’S from sources believed by it to be accurate and reliable. Because of the possibility of human or mechanical error as well
as other factors, however, all information contained herein is provided “AS IS” without warranty of any kind. MOODY'S adopts all necessary measures so that the information it
uses in assigning a credit rating is of sufficient quality and from sources MOODY'S considers to be reliable including, when appropriate, independent third-party sources. However,
MOODY’S is not an auditor and cannot in every instance independently verify or validate information received in the rating process or in preparing its Publications.
To the extent permitted by law, MOODY’S and its directors, officers, employees, agents, representatives, licensors and suppliers disclaim liability to any person or entity for any
indirect, special, consequential, or incidental losses or damages whatsoever arising from or in connection with the information contained herein or the use of or inability to use any
such information, even if MOODY’S or any of its directors, officers, employees, agents, representatives, licensors or suppliers is advised in advance of the possibility of such losses or
damages, including but not limited to: (a) any loss of present or prospective profits or (b) any loss or damage arising where the relevant financial instrument is not the subject of a
particular credit rating assigned by MOODY’S.
To the extent permitted by law, MOODY’S and its directors, officers, employees, agents, representatives, licensors and suppliers disclaim liability for any direct or compensatory
losses or damages caused to any person or entity, including but not limited to by any negligence (but excluding fraud, willful misconduct or any other type of liability that, for the
avoidance of doubt, by law cannot be excluded) on the part of, or any contingency within or beyond the control of, MOODY’S or any of its directors, officers, employees, agents,
representatives, licensors or suppliers, arising from or in connection with the information contained herein or the use of or inability to use any such information.
NO WARRANTY, EXPRESS OR IMPLIED, AS TO THE ACCURACY, TIMELINESS, COMPLETENESS, MERCHANTABILITY OR FITNESS FOR ANY PARTICULAR PURPOSE OF ANY CREDIT
RATING, ASSESSMENT, OTHER OPINION OR INFORMATION IS GIVEN OR MADE BY MOODY’S IN ANY FORM OR MANNER WHATSOEVER.
Moody’s Investors Service, Inc. , a wholly-owned credit rating agency subsidiary of Moody’s Corporation (“MCO”), hereby discloses that most issuers of debt securities (including
corporate and municipal bonds, debentures, notes and commercial paper) and preferred stock rated by Moody’s Investors Service, Inc. have, prior to assignment of any credit rating,
agreed to pay to Moody’s Investors Service, Inc. for credit ratings opinions and services rendered by it fees ranging from $1,000 to approximately $5,000,000 . MCO and Moody’s
Investors Service also maintain policies and procedures to address the independence of Moody’s Investors Service credit ratings and credit rating processes. Information regarding
certain affiliations that may exist between directors of MCO and rated entities, and between entities who hold credit ratings from Moody’s Investors Service and have also publicly
reported to the SEC an ownership interest in MCO of more than 5%, is posted annually at
under the heading “Investor Relations — Corporate Governance —
Director and Shareholder Affiliation Policy.”
Additional terms for Australia only: Any publication into Australia of this document is pursuant to the Australian Financial Services License of MOODY’S affiliate, Moody’s Investors
Service Pty Limited ABN 61 003 399 657AFSL 336969 and/or Moody’s Analytics Australia Pty Ltd ABN 94 105 136 972 AFSL 383569 (as applicable). This document is intended
to be provided only to “wholesale clients” within the meaning of section 761G of the Corporations Act 2001. By continuing to access this document from within Australia , you
represent to MOODY’S that you are, or are accessing the document as a representative of, a “wholesale client” and that neither you nor the entity you represent will directly or
indirectly disseminate this document or its contents to “retail clients” within the meaning of section 761G of the Corporations Act 2001. MOODY’S credit rating is an opinion as to
the creditworthiness of a debt obligation of the issuer, not on the equity securities of the issuer or any form of security that is available to retail investors.
Additional terms for Japan only: Moody's Japan K.K. (“MJKK”) is a wholly-owned credit rating agency subsidiary of Moody's Group Japan G.K., which is wholly-owned by Moody’s
Overseas Holdings Inc. , a wholly-owned subsidiary of MCO. Moody’s SF Japan K.K. (“MSFJ”) is a wholly-owned credit rating agency subsidiary of MJKK. MSFJ is not a Nationally
Recognized Statistical Rating Organization (“NRSRO”). Therefore, credit ratings assigned by MSFJ are Non-NRSRO Credit Ratings. Non-NRSRO Credit Ratings are assigned by an
entity that is not a NRSRO and, consequently, the rated obligation will not qualify for certain types of treatment under U.S. laws. MJKK and MSFJ are credit rating agencies registered
with the Japan Financial Services Agency and their registration numbers are FSA Commissioner (Ratings) No. 2 and 3 respectively.
MJKK or MSFJ (as applicable) hereby disclose that most issuers of debt securities (including corporate and municipal bonds, debentures, notes and commercial paper) and preferred
stock rated by MJKK or MSFJ (as applicable) have, prior to assignment of any credit rating, agreed to pay to MJKK or MSFJ (as applicable) for credit ratings opinions and services
rendered by it fees ranging from JPY125,000 to approximately JPY550,000,000 .
MJKK and MSFJ also maintain policies and procedures to address Japanese regulatory requirements.
REPORT NUMBER
1313878
10 9 December 2021
Cross-Sector: Market Data Highlights

MOODY'S ANALYTICS
CROSS-SECTOR
CLIENT SERVICES
Americas
1-212-553-1653
Asia Pacific
852-3551-3077
Japan
81-3-5408-4100
EMEA
44-20-7772-5454
11 9 December 2021
Cross-Sector: Market Data Highlights
