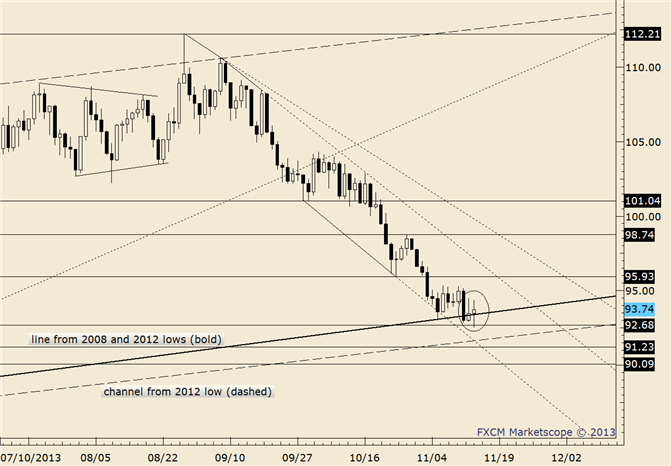
Crude Daily Close is Highest Since March 2012
Weekly

Chart Prepared by Jamie Saettele, CMT using Marketscope 2.0
Interested in automated trading with Mirror Trader?
Commodity Analysis: Crude’s breakout rally finally found formidable resistance just above 107. 106.58 was the highest weekly close in 2012 and 106.97 was is the 161.8% extension of the 98.21-84.04 range. An inverse head and shoulders target does rest at 109.05. Crude made a large range key reversal on Thursday but the move was on lackluster volume and the larger breakout is more significant.
Commodity Trading Strategy: Can’t chase here…if price completes a flat correction or triangle over the next few days then we’ll have a chance to participate.
LEVELS: 103.95 104.96 105.89 107.43 109.05 110.53
DailyFX provides forex news and technical analysis on the trends that influence the global currency markets.
Learn forex trading with a free practice account and trading charts from FXCM.

