Crude Oil Price Update – Market Sitting Inside $58.95 to $54.79 Retracement Zone
U.S. West Texas Intermediate crude oil futures are trading slightly lower early Thursday. The move comes as a surprise since Wednesday’s American Petroleum Institute’s weekly report showed U.S. inventories rose more than expected. Traders are now preparing for the U.S. Energy Information Administration’s (EIA) report due to be released at 1600 GMT. It is expected to show a build of 2.9 million barrels.
At 0623 GMT, January WTI crude oil futures are trading $56.35, down $0.09 or -0.14%.

Daily Technical Analysis
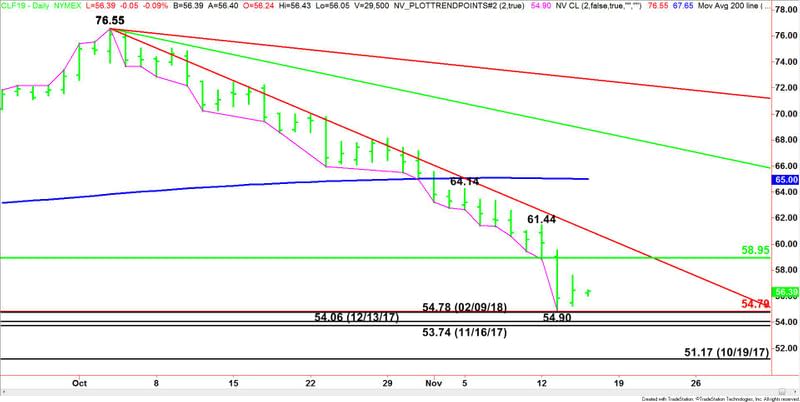
The main trend is down according to the daily swing chart. A trade through $54.90 will signal a resumption of the downtrend with targets coming in at $54.78, $54.06 and $53.74. Taking out $53.74 could trigger a plunge into the October 19, 2017 main bottom at $51.17.
A closing price reversal bottom will indicate the buying is greater than the selling at current price levels. A “W” formation will be another sign of bottoming action, but it is going to take at least 5 days to form.
The market is currently trading inside the retracement zone formed by the main bottom at $41.34 and the main top at $76.55. The 50% to 61.8% retracement zone is $58.95 to $54.79.
The minor trend is also down. The nearest minor top is $61.44. A trade through this level will change the minor trend to up. This will also shift momentum to the upside.
Daily Technical Forecast
Based on the early price action, traders are trying to establish support at $54.90, followed by $54.79 to $54.78. These levels are followed by $54.06 and $53.74. The daily chart opens up to the downside under $53.74 with $51.17 the next likely downside target.
Taking out $54.90 then trading back over yesterday’s close at $56.44 will indicate the buying is greater than the selling at current price levels. This will put the December WTI crude oil market in a position to post a closing price reversal bottom.
Holding above $54.90 will also signal the presence of buyers, but this move will not be as dramatic as the closing price reversal bottom. Holding $54.90 will indicate the selling is slowing down, but not necessary that shorts are covering.
In order to form a good bottom, we need to get the shorts to cover aggressively.
Crossing to the bullish side of the 50% level at $58.95 will be a sign of strength. If this creates enough upside momentum then look for the rally to possibly extend into the downtrending Gann angle at $61.05.
This article was originally posted on FX Empire
More From FXEMPIRE:
E-mini Dow Jones Industrial Average (YM) Futures Analysis – Inside Major RT Zone at 25233 to 24824
GBP/USD Price Forecast – Pound Sinks After UK Brexit Minister Resigns
Price of Gold Fundamental Daily Forecast – Gold Weakens as Dollar Rises after Brexit Resignation
EUR/USD Price Forecast – EUR/USD Recovers on US Greenback’s Weakness
